. 2018 Oct 2:9:1331.
doi: 10.3389/fpls.2018.01331. eCollection 2018.

The Combined Loss of Triose Phosphate and Xylulose 5-Phosphate/Phosphate Translocators Leads to Severe Growth Retardation and Impaired Photosynthesis in Arabidopsis thaliana tpt/xpt Double Mutants

Affiliations

The Combined Loss of Triose Phosphate and Xylulose 5-Phosphate/Phosphate Translocators Leads to Severe Growth Retardation and Impaired Photosynthesis in Arabidopsis thaliana tpt/xpt Double Mutants

Elke J A Hilgers et al. Front Plant Sci. .

Abstract

The xylulose 5-phosphate/phosphate translocator (XPT) represents the fourth functional member of the phosphate translocator (PT) family residing in the plastid inner envelope membrane. In contrast to the other three members, little is known on the physiological role of the XPT. Based on its major transport substrates (i.e., pentose phosphates) the XPT has been proposed to act as a link between the plastidial and extraplastidial branches of the oxidative pentose phosphate pathway (OPPP). As the XPT is also capable of transporting triose phosphates, it might as well support the triose phosphate PT (TPT) in exporting photoassimilates from the chloroplast in the light ('day path of carbon') and hence in supplying the whole plant with carbohydrates. Two independent knockout mutant alleles of the XPT (xpt-1 and xpt-2) lacked any specific phenotype, suggesting that the XPT function is redundant. However, double mutants generated from crossings of xpt-1 to different mutant alleles of the TPT (tpt-1 and tpt-2) were severely retarded in size, exhibited a high chlorophyll fluorescence phenotype, and impaired photosynthetic electron transport rates. In the double mutant the export of triose phosphates from the chloroplasts is completely blocked. Hence, precursors for sucrose biosynthesis derive entirely from starch turnover ('night path of carbon'), which was accompanied by a marked accumulation of maltose as a starch breakdown product. Moreover, pentose phosphates produced by the extraplastidial branch of the OPPP also accumulated in the double mutants. Thus, an active XPT indeed retrieves excessive pentose phosphates from the extra-plastidial space and makes them available to the plastids. Further metabolic profiling revealed that phosphorylated intermediates remained largely unaffected, whereas fumarate and glycine contents were diminished in the double mutants. The assessment of C/N-ratios suggested co-limitations of C- and N-metabolism as possible cause for growth retardation of the double mutants. Feeding of sucrose partially rescued the growth and photosynthesis phenotypes of the double mutants. Immunoblots of thylakoid proteins, spectroscopic determinations of photosynthesis complexes, and chlorophyll a fluorescence emission spectra at 77 Kelvin could only partially explain constrains in photosynthesis observed in the double mutants. The data are discussed together with aspects of the OPPP and central carbon metabolism.

Keywords: chloroplasts; pentose phosphates; photosynthesis; signaling; transport.


Figures
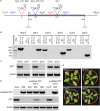
FIGURE 1
FIGURE 1
Molecular characterization of XPT T-DNA insertion mutants and amiRNA:XPT lines in the Ws-2 or Col-0 background. (A) XPT gene structure with the individual T-DNA insertions as well as the locations of primer pairs for the identification of the inserts. (B) Amplification pattern of genomic DNA fragments using gene specific and/or T-DNA left border (LB) primers as indicated. (C) XPT expression based on RT-PCR fragments generated from RNA isolated from wild-type plants or T-DNA insertion mutants as indicated. As a control, Actin2 was used. (D) Molecular analyses of amiRNA:XPT insertion lines in the Ws-2 or Col-0 background. The upper panel shows fragments of the amiRNA:XPT construct amplified by PCR on genomic DNA of the individual lines. In the lower panels RT-PCR fragments of the XPT or actin2 (control) are displayed for the individual lines. (E) Compared to the respective wild-type plants the xpt-1 and xpt-2 mutant alleles lacked any visible phenotype when grown under SL-conditions (PFD = 150 μmol⋅m-2⋅s-1) in the long-day.
FIGURE 2
FIGURE 2
Characterization of mutant and amiRNA plants with defects in the TPT and XPT. In (A) phenotypes of wild-type plants, single or double mutants impaired in the TPT and XPT, as well as amiRNA:XPT overexpressors in the tpt-2 background are shown. As an additional control adg1-1/tpt-2 plants are displayed. The plants were grown either under LL- (PFD = 30 μmol⋅m-2⋅s-1), SL- (PFD = 150 μmol⋅m-2⋅s-1), or HL-conditions (PFD = 300 μmol⋅m-2⋅s-1) in the long-day, or under SL-conditions in the short-day. (B) RT-PCR-amplified transcripts of amiRNA:XPT (upper panel), XPT (middle panel), and, as a control, Actin2 (lower panel) in Col-0 wild-type plants, the tpt-2 single mutant, and the amiRNA:XPT overexpressing lines #3 and #4 in the tpt-2 background. The space bar represents 1 cm. In (C,D) growth rates of leaf rosettes and roots, respectively, are shown for Ws-2 (closed black circles), Col-0 (closed black squares), xpt-1 (closed dark red circles), tpt-2 (closed blue squares), tpt-2/xpt-1 (closed purple diamonds), and the amiRNA:XPT lines in the tpt-2 background #3 (closed purple squares) and #4 (open purple squares). Note the different scales of the y-axis in the lower part of the graphs. The plants in (C) were grown in soil under SL-conditions in the long-day. Root growth in (D) was assessed on 1/2MS agar plates under SL-conditions in the-long day. A statistical analysis of the growth parameters is contained in Doc S1, Table 1.
FIGURE 3
FIGURE 3
Photosynthetic characteristics of wild-type (Ws-2, Col-0) and mutant plants defective in the TPT and XPT. In (A) false-colour images of Fo and the Fv/Fm-ratios are displayed for plants grown for 20 days under LL- (PFD = 30 μmol⋅m-2⋅s-1) or for 12 days under HL-conditions (PFD = 300 μmol⋅m-2⋅s-1) in the long-day, or for 43 days under SL-conditions (PFD = 150 μmol⋅m-2⋅s-1) in the short-day. For the latter details of the fluorescence distribution or of Fv/Fm-ratios are depicted (lower panel). In (B,C) induction and light curves, respectively, of relative ETR are shown for wild-type plants, the xpt-1, tpt-1, and tpt-2 single mutants as well as for tpt-1/xpt-1, and tpt-2/xpt-1 double mutants and an amiRNA:XPT overexpressor in the tpt-2 background grown under HL-conditions. The actinic light during the induction of photosynthesis was set to a PFD of 281 μmol⋅m-2⋅s-1. As an additional control the adg1-1/tpt-2 double mutant was included in this experiment.
FIGURE 4
FIGURE 4
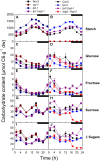
Diurnal changes in carbohydrate contents in leaves of wild-type and mutant plants. Contents of starch (A,B), the soluble sugars Glc (C,D), Fru (E,F), Suc (G,H) were determined and the sum the soluble sugars (I,J) calculated for Ws-2 (closed black circles), tpt-1 (closed dark blue circles), xpt-1 (closed dark red circles), tpt-1/xpt-1 (closed dark purple circles), Col-0 (closed black squares), tpt-2 (closed blue squares), tpt-2/xpt-1 (closed dark purple diamonds), and adg1-1/tpt-2 (closed red squares). The plants were grown in soil under HL-conditions (PFD = 300 μmol⋅m-2⋅s-1) in the long-day. The data represent the mean ± SE of n = 5 replicates. A statistical analysis is contained in Doc S2, Table 4.
FIGURE 5
FIGURE 5
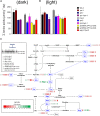
Metabolome analyses of wild-type and mutants plants. Wild-type and mutant plants impaired in the TPT and/or XPT were grown for 3 weeks under HL-conditions (PFD = 300 μmol⋅m-2⋅s-1) in the long-day. Samples for metabolite extractions were taken either at about the middle of the dark period (i.e., 5 h in the dark), at the beginning of the light period (i.e., 1 h in the light), or in the middle of the light period (i.e., 8 h in the light). The small heatmaps for each metabolite and the color scheme for the log2-ratios are defined under ‘Samples and Conditions’. The background colors in the metabolic sketch highlight aspects of various pathways, i.e., light green, reactions specific for the Calvin-Benson cycle including initial reactions of photorespiration; light blue, reactions of the OPPP and the overlap with the Calvin-Benson cycle; light cyan, reactions of photorespiration; light brown, glycolysis and TCA cycle as well as aspects of amino acid biosynthesis; light grey, carbohydrate metabolism. The colors of the arrows incidate more specifically reactions of individual pathways or groups of pathways, i.e., green, Calvin-Benson cycle and photorespiration; dark red, oxidative part of the OPPP; dark blue, regenerative part of the OPPP and Calvin-Benson cycle; blue, carbohydrate metabolism; red glycolysis and TCA; purple, amino acid metabolism including the shikimate pathway. The metabolites in black letters have been determined by GC-MS or LC-MS/MS whereas the grey-lettered metabolites indicate important intermediates that have not been determined. All phosphorylated metabolites, ATP and AMP, as well as Asn and Trp were determined by LC-MS/MS, all remaining metabolites were determined by GC-MS. Please note that, for the sake of clarity, compartmentation has been omitted. The data represent the mean ± SE of n = 3 to 5 replicates. The metabolite contents at each time point of the day are contained in Supplementary Tables 4, 5 with a statistical analysis in Doc S2, Tables 5, 6.
FIGURE 6
FIGURE 6
Contents of soluble amino acids in leaves of wild-type and mutant plants. Amino acid contents were determined by HPLC in samples extracted from rosette leaves harvested after 4 h in the dark (i.e., the middle of the dark period) or 8 h in the light (i.e., the middle of the light period). The plants were grown in soil under HL-conditions (PFD = 300 μmol⋅m-2⋅s-1) in the long-day. Contents of total amino acids (expressed as sum of the individual amino acids) are shown in (A) and (B) for the middle of the dark- and light period, respectively. In the metabolic sketch (C) the major paths of amino acid biosynthesis are illustrated. The framed amino acids in blue letters have been determined by HPLC and contain heatmaps based on log2-ratios (indicated by the color sheme) of relative changes in their content (i.e., as percent of the summed amino acids) compared to wild-type plants. The heatmap pattern is defined under ‘Samples and Conditions’. The data represents the mean ± SE of n = 4 to 5 independent replicates. A detailed list of absolute and relative amino acid contents is contained in Supplementary Table 6. A statistical analysis is contained in Doc S2, Table 7.
FIGURE 7
FIGURE 7
Photosynthesis parameters of wild-type and mutant plants grown on agar with or without substrates. Wild-type plants and double mutants impaired in the TPT and XPT as well as triple mutants with an additional defect in GPT2 were grown on 1/2 strength MS agar in the absence or presence of 50 mM Suc, 2 mM Gln, either alone or in combination. The plants were grown under HL-conditions (PFD = 300 μmol⋅m-2⋅s-1) in the long-day. As an additional control the adg1-1/tpt-2 double mutant was included in this experiment. The left panel (A–H) shows images of the Fv/Fm-ratio after the plants were dark-adapted for 30 min at day 15 (A,C,E,G) or day 19 (B,D,F,G) after sowing. The numbers in (A) indicate the individual lines with Ws-2 (1), tpt-1/xpt-1 (2), Col-0 (3), tpt-2/xpt-2 (4), gpt2-1/tpt-2/xpt-1 (5), and adg1-1/tpt-2 (6). The right panel shows induction kinetics of photosynthetic ETR of both wild types (I,K,M,O) and the individual mutant lines (J,L,N,P) at day 19 after sowing. The data represent the mean ± SE of n = 5 replicates. In some cases error bars were smaller than the symbol size. The color-code for the individual lines is given in the Figure. Additional information on this experiment is contained in Supplementary Figures 5, 6. A statitical analysis is contained in Doc S2, Tables 11, 12.
FIGURE 8
FIGURE 8
Immunoblots of thylakoid proteins, spectroscopic determinations of functional PS components, and fluorescence emission spectra of Chl a at 77 K. (A) Immunoblots of thylakoid proteins associated with photosynthesis after separation of total proteins isolated from leaves of HL-grown Col-0 and Ws-2 wild-type plants, the xpt-1 and tpt-2 single mutants as well as the tpt-1/xpt-1, tpt-2/xpt-1, and adg1-1/tpt-2 double mutants on SDS–PAGE. All gels for the blots were loaded on an equal total leaf protein basis (approximately 10 μg per lane) and a dilution series of Col-0 was used for semi-quantitative analyses. (B) Spectroscopic determinations of functional components of PSII, PSI and the cyt b6/f complex. The data represent the mean ± SE of n = 3 experiments. A statistical analysis of the data is contained in Doc S2, Table 13. (C) Relative fluorescence emission spectra of Chl in isolated thylakoids from Ws-2 and Col-0 wild-type plants as well as tpt-1/xpt-1 and tpt-2/xpt-1 double mutants and the amiRNA:XPT tpt-2 #4 line determined at 77K. The spectra were normalized for the peak intensity at 687 nm. The vertical black lines indicate absorption maxima of PSII and PSI components, whereas the blue vertical lines point at expected absorption maxima of free LHCII or LHCI not attached to the core components of both photosystems.
FIGURE 9
FIGURE 9
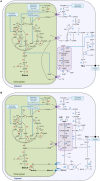
Metabolic sketches of carbohydrate metabolism in a mesophyll cell of wild-tpye and mutant plants defective in the TPT and XPT during illumination. In (A) the major path of carbon from CO2 assimilation in the Calvin-Benson cycle to starch in the stroma and Suc in the cytosol as well as glycolysis are illustrated for wild-type plants, whereas in (B) the diversion of carbon flow via starch turnover (i.e., the ‘night path of cabon’) and the utilization of Glc and maltose for Suc biosynthesis is shown for tpt-1[2]/xpt-1. Furthermore the extraplastidial branch of the OPPP, which might be localized in the cytosol or peroxisomes (P) leads to an accumulation of pentose phosphates only in the double mutant. A GPT has been included in (B) in order to demonstrate that, in principle, an exchange of Glc6P across the envelope would be possible. The numbers in italics denote the enzymes: 1 ribulose-1,5-bisphosphate carboxylase/oxygenase (RubisCO), 2 phosphoglycerate kinase (PGK), 3 NADP glyceraldehyde-3-phosphate dehydrogenase (NADP-GAPDH), 4 triosephosphate isomerase (TIM), 5a,b (trans)aldolase, 6 fructose-1,6-bisphosphatase (FbPase), 7a,b transketolase, 8 sedoheptulose-1,7-bisphosphatase (SbPase), 9 ribose-5-phosphate isomerase, 10 ribulose-5-phosphate epimerase, 11 phosphoribulokinase (PRK), 12 phosphoglucose isomerase (GPI), 13 phosphoglucomutase (PGM), 14 ADPglucose pyrophosphorylase (ADG), 15 inorganic pyrophosphatase (PPiase), 15b PPiase and/or PPi-dependent tonoplast proton pump and/or PFP (see 33), 16 starch synthases (both soluble and glranule-bound), 17 UDPglucose pyrophosphorylase (UDG), 18 sucrose phosphate synthase (SPS), 19 sucrose phosphate phosphatase (SPP), 20 NAD-GAPDH, 21 glycolytic PGK, 22 phosphoglycero mutase (PGyM), 23 enolase, 24 pyruvate kinase, 25 glucose 6-phosphate dehydrogenase (G6PDH), 26 6-phosphoglucono-lactonase, 27 6-phosphogluconate dehydrogenase, 28 isoamylase and disproportionating enzyme1 (DPE1) (a) or 2 (DPE2) (b), 29 β-amylase, 30 cytosolic glucane phosphorylase (PSH2). 31 hexokinase (HK), 32 phosphofructokinase (PFK), 33, pyrophosphate-dependent phosphofructokinase (PFP; see 15b).

Similar articles

Cited by

References

    1. Anderson J. M. (1992). Cytochrome b6f complex: dynamic molecular organization, function and acclimation. Photosynth. Res. 34 341–357. 10.1007/BF00029810 - DOI - PubMed
    1. Arrivault S., Guenther M., Ivakov A., Feil R., Vosloh D., van Dongen J. T., et al. (2009). Use of reverse-phase liquid chromatography, linked to tandem mass spectrometry, to profile the Calvin cycle and other metabolic intermediates in Arabidopsis rosettes at different carbon dioxide concentrations. Plant J. 59 824–839. 10.1111/j.1365-313X.2009.03902.x - DOI - PubMed
    1. Baxter C. J., Redestig H., Schauer N., Repsilber D., Patil K. R., Nielsen J., et al. (2007). The metabolic response of heterotrophic Arabidopsis cells to oxidative stress. Plant Physiol. 143 312–325. 10.1104/pp.106.090431 - DOI - PMC - PubMed
    1. Bondarava N., Gross C. M., Mubarakshina M., Golecki J. R., Johnson G. N., Krieger-Liszkay A. (2010). Putative function of cytochrome b559 as a plastoquinol oxidase. Physiol. Plant. 138 463–473. 10.1111/j.1399-3054.2009.01312.x - DOI - PubMed
    1. Bradford M. M. (1976). A rapid and sensitive method for the quantitation of microgram quantities of protein utilizing the principle of protein-dye binding. Anal. Biochem. 72 248–254. 10.1016/0003-2697(76)90527-3 - DOI - PubMed