. 2018 Oct 3:9:385.
doi: 10.3389/fgene.2018.00385. eCollection 2018.

Combining Landscape Genomics and Ecological Modelling to Investigate Local Adaptation of Indigenous Ugandan Cattle to East Coast Fever

Affiliations

Combining Landscape Genomics and Ecological Modelling to Investigate Local Adaptation of Indigenous Ugandan Cattle to East Coast Fever

Elia Vajana et al. Front Genet. .

Abstract

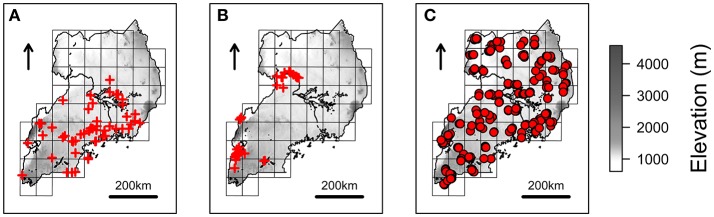
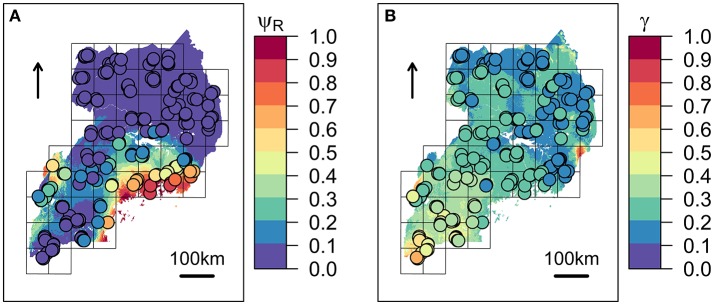
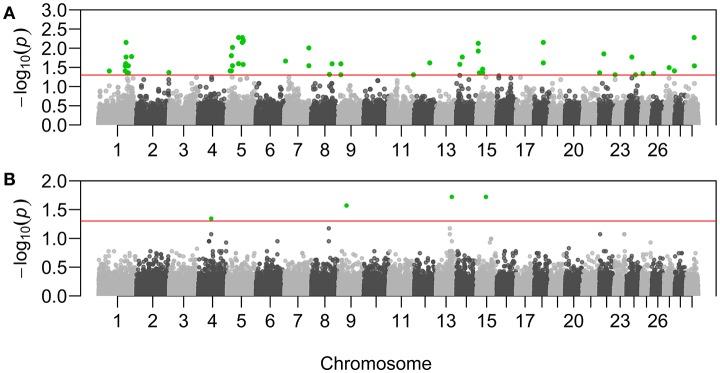
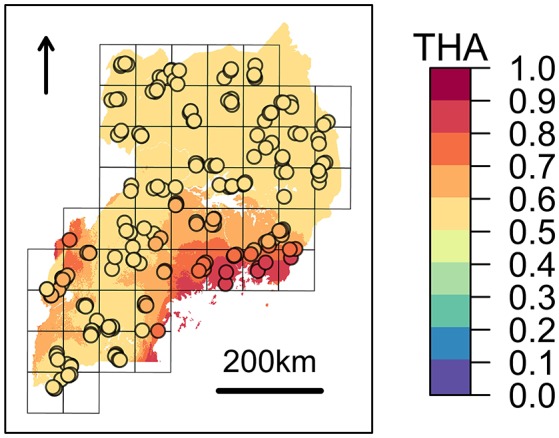
East Coast fever (ECF) is a fatal sickness affecting cattle populations of eastern, central, and southern Africa. The disease is transmitted by the tick Rhipicephalus appendiculatus, and caused by the protozoan Theileria parva parva, which invades host lymphocytes and promotes their clonal expansion. Importantly, indigenous cattle show tolerance to infection in ECF-endemically stable areas. Here, the putative genetic bases underlying ECF-tolerance were investigated using molecular data and epidemiological information from 823 indigenous cattle from Uganda. Vector distribution and host infection risk were estimated over the study area and subsequently tested as triggers of local adaptation by means of landscape genomics analysis. We identified 41 and seven candidate adaptive loci for tick resistance and infection tolerance, respectively. Among the genes associated with the candidate adaptive loci are PRKG1 and SLA2. PRKG1 was already described as associated with tick resistance in indigenous South African cattle, due to its role into inflammatory response. SLA2 is part of the regulatory pathways involved into lymphocytes' proliferation. Additionally, local ancestry analysis suggested the zebuine origin of the genomic region candidate for tick resistance.

Keywords: East Coast fever; indigenous cattle; landscape genomics; local adaptation; species distribution modelling.


Figures

Figure 1
Figure 1
Species occurrences and NextGen sampling scheme. Red crosses represents the spatial records used to estimate Rhipicephalus appendiculatus (A) and Syncerus caffer (B) distributions over Uganda, as derived from Cumming (1999b) and GBIF (2012), respectively. Farms where cattle have been sampled to be genotyped and tested for Theileria parva parva infection are represented with red circles (C). The grid scheme used to sample farms during the NextGen project is shown on the background of each map (see main text), together with elevation.
Figure 2
Figure 2
Predicted spatial distributions for ECF vector and infection risk in cattle. (A) Rhipicephalus appendiculatus occurrence probability (ψR) as predicted by the selected distribution model. (B) Predicted Theileria parva parva infection risk (γ). Colour from blue to red tones corresponds to increasing values of ψR and γ. Sampled farms are represented with circles, and coloured according to ψR and γ values estimated at their geographical location.
Figure 3
Figure 3
Manhattan plots of the genotype-environment associations. X-axis reports chromosomal position of the tested SNPs on B. taurus chromosomes. Y-axis reports the test statistic p-values (p) for the associations with Rhipicephalus appendiculatus occurrence probability (A), and with Theileria parva parva infection risk (B). P-values are displayed for each genotype after the Benjamini-Hochberg (BH) correction, and on the –log10 scale. Nominal significance threshold (αBH=0.05) is displayed as a red line, and significant p-values are highlighted in green.
Figure 4
Figure 4
Expected zebuine proportion of the genomic region candidate for tick resistance. The association inferred through beta regression between Tharparkar ancestry (THA) and average Rhipicephalus appendiculatus occurrence probability per cell (Table 6) was used to generalize expected zebuine ancestry over Uganda. Colour key corresponds to predicted THA proportion, with increasing values from the blue to the red tones. Sampled farms are represented with circles, and coloured according to the predicted THA proportion at their geographical location.

References

    1. Aho K., Derryberry D., Peterson T. (2014). Model selection for ecologists: the worldviews of AIC and BIC. Ecology 95, 631–636. 10.1890/13-1452.1 - DOI - PubMed
    1. Aken B. L., Ayling S., Barrell D., Clarke L., Curwen V., Fairley S., et al. (2016). The Ensembl gene annotation system. Database 2016:baw093. 10.1093/database/baw093 - DOI - PMC - PubMed
    1. Alexander D. H., Novembre J., Lange K. (2009). Fast model-based estimation of ancestry in unrelated individuals. Genome Res. 19, 1655–1664. 10.1101/gr.094052.109 - DOI - PMC - PubMed
    1. Bahbahani H., Hanotte O. (2015). Genetic resistance: tolerance to vector-borne diseases and the prospects and challenges of genomics. Rev. Sci. Tech 34, 185–197. Available online at: https://pdfs.semanticscholar.org/9dfc/e06d6cf47093061024ff324a013e93cdd7... - PubMed
    1. Bahbahani H., Tijjani A., Mukasa C., Wragg D., Almathen F., Nash O., et al. (2017). Signatures of selection for environmental adaptation and zebu × taurine hybrid fitness in East African Shorthorn Zebu. Front. Genet. 8:68. 10.3389/fgene.2017.00068 - DOI - PMC - PubMed

LinkOut - more resources