

The Importance of the Baby Boom Cohort and the Great Recession in Understanding Age, Period, and Cohort Patterns in Happiness
- PMID: 30333903
- PMCID: PMC6188634
- DOI: 10.1177/1948550616673874
The Importance of the Baby Boom Cohort and the Great Recession in Understanding Age, Period, and Cohort Patterns in Happiness
Abstract
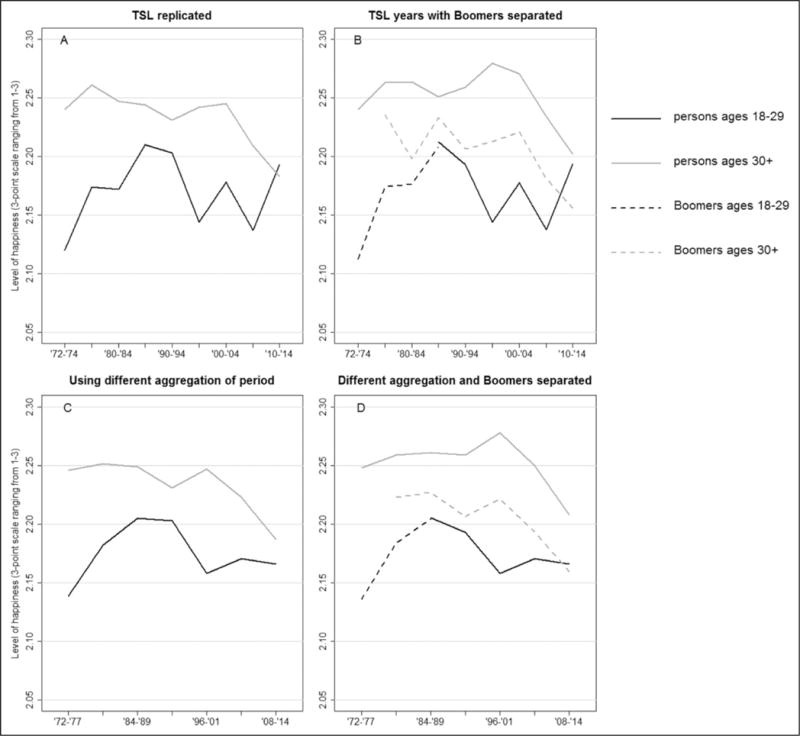
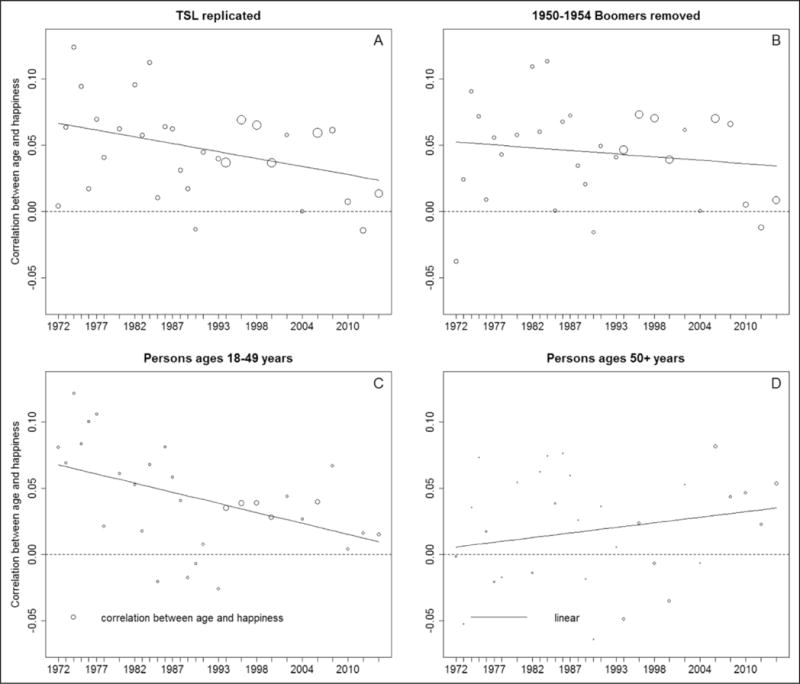
Twenge, Sherman, and Lyubomirsky (TSL) claim that long-term cultural changes have increased young adults' happiness while reducing mature adults' happiness. To establish their conclusion, TSL use trend analyses, as well as more sophisticated mixed-effects models, but their analyses are problematic. In particular, TSL's trend analyses ignore a crucial cohort effect: well-known lower happiness among baby boomers. Furthermore, their data aggregation obscures the ephemerality of a recent period effect: the Great Recession. Finally, TSL overlook a key finding of their mixed-effects models that both pre- and post-Boomer cohorts became happier as they aged from young to mature adults. Our reanalyses of the data establish that the Baby Boomer cohort, the short-lived Great Recession, and unfortunate data aggregation account for TSL's results. The well-established, long-term relationship between age and happiness remains as it has been for decades despite any cultural shifts that may have occurred disfavoring mature adults.
Keywords: Baby Boomers; Great Recession; age–period–cohort; aging; happiness; subjective well-being.
Conflict of interest statement
Declaration of Conflicting Interests The author(s) declared no potential conflicts of interest with respect to the research, authorship, and/or publication of this article.
Figures


References
-
- Bell DN, Blanchflower DG. Young people and the Great Recession. Oxford Review of Economic Policy. 2011;27:241–267.
-
- Bell A, Jones K. Should age-period-cohort analysts accept innovation without scrutiny? A response to Reither, Masters, Yang, Powers, Zheng, and Land. Social Science & Medicine. 2015;128:331–333. - PubMed
-
- Blendon RJ, Benson JM. The public’s views about Medicare and the budget deficit. New England Journal of Medicine. 2011;365:e8. - PubMed
-
- Easterlin RA. Birth and fortune: The impact of numbers on personal welfare. Chicago, IL: University of Chicago; 1980.
-
- Fukuda K. A happiness study using age-period-cohort framework. Journal of Happiness Studies. 2013;14:135–153.
Grants and funding
LinkOut - more resources
Full Text Sources