. 2018 Oct 2:8:330.
doi: 10.3389/fcimb.2018.00330. eCollection 2018.

Transcriptional Profile of Mycobacterium tuberculosis in an in vitro Model of Intraocular Tuberculosis

Affiliations

Transcriptional Profile of Mycobacterium tuberculosis in an in vitro Model of Intraocular Tuberculosis

Sudhanshu Abhishek et al. Front Cell Infect Microbiol. .

Abstract

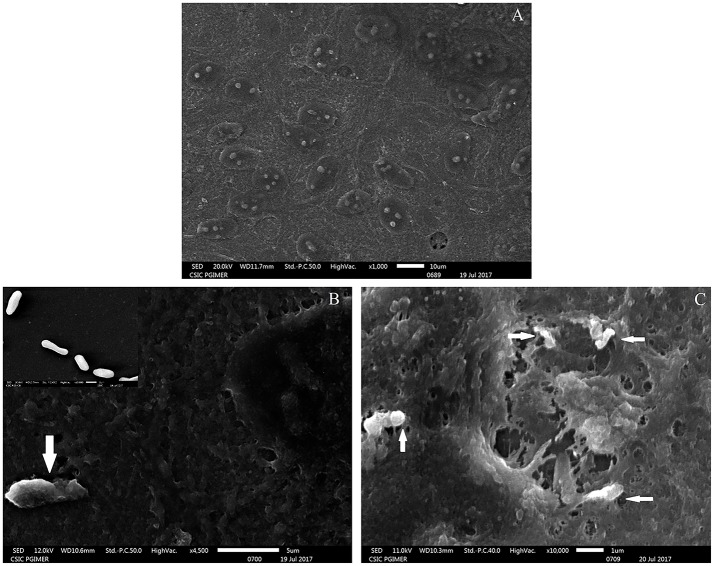
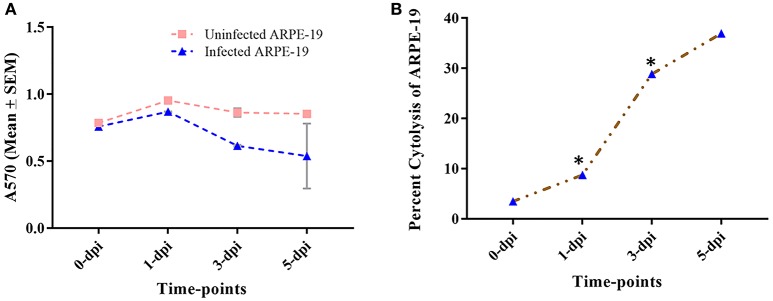
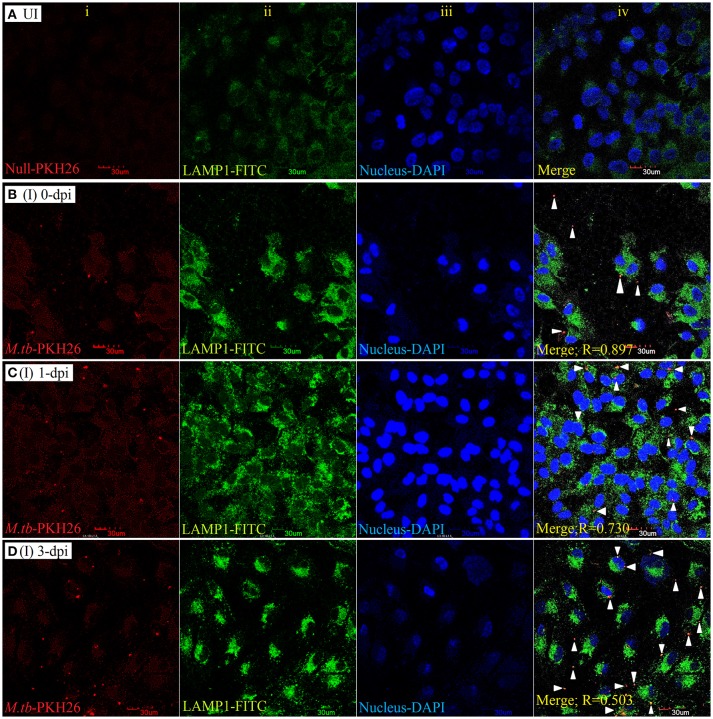
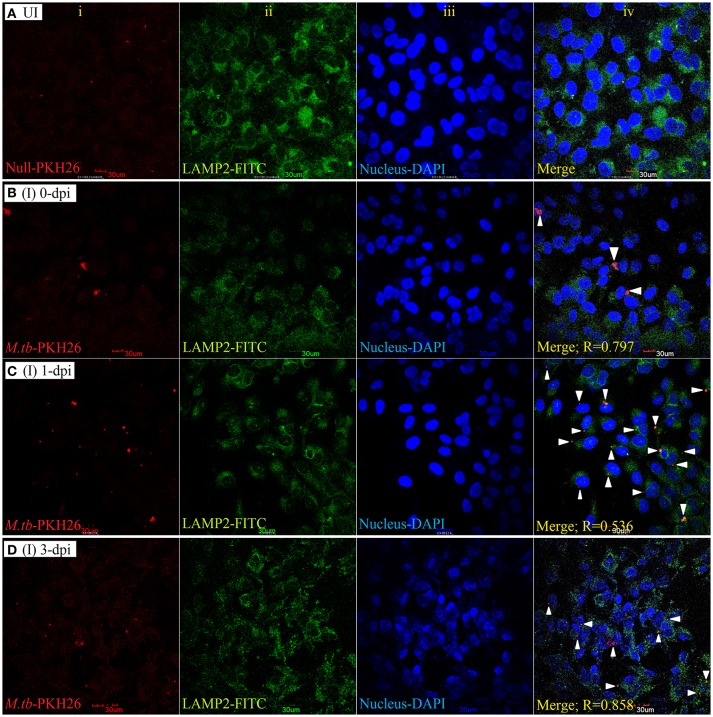
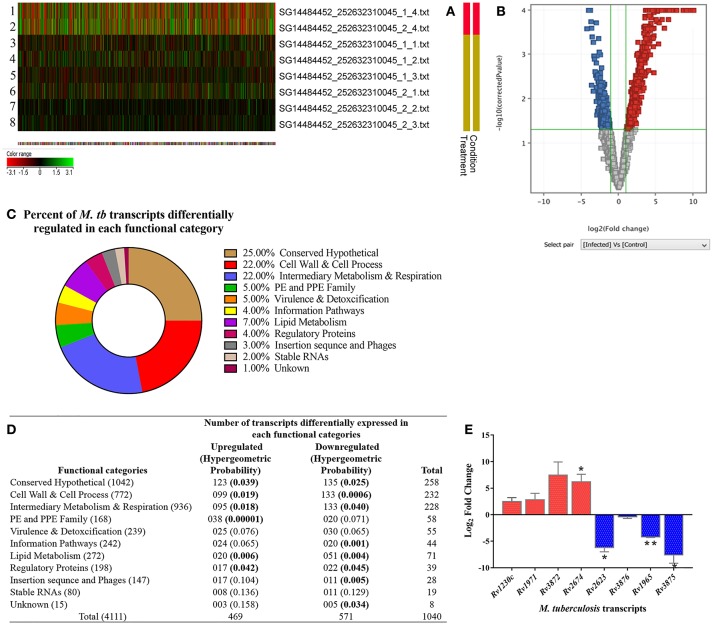
Background: Intraocular tuberculosis (IOTB), an extrapulmonary manifestation of tuberculosis of the eye, has unique and varied clinical presentations with poorly understood pathogenesis. As it is a significant cause of inflammation and visual morbidity, particularly in TB endemic countries, it is essential to study the pathogenesis of IOTB. Clinical and histopathologic studies suggest the presence of Mycobacterium tuberculosis in retinal pigment epithelium (RPE) cells. Methods: A human retinal pigment epithelium (ARPE-19) cell line was infected with a virulent strain of M. tuberculosis (H37Rv). Electron microscopy and colony forming units (CFU) assay were performed to monitor the M. tuberculosis adherence, invasion, and intracellular replication, whereas confocal microscopy was done to study its intracellular fate in the RPE cells. To understand the pathogenesis, the transcriptional profile of M. tuberculosis in ARPE-19 cells was studied by whole genome microarray. Three upregulated M. tuberculosis transcripts were also examined in human IOTB vitreous samples. Results: Scanning electron micrographs of the infected ARPE-19 cells indicated adherence of bacilli, which were further observed to be internalized as monitored by transmission electron microscopy. The CFU assay showed that 22.7 and 8.4% of the initial inoculum of bacilli adhered and invaded the ARPE-19 cells, respectively, with an increase in fold CFU from 1 dpi (0.84) to 5dpi (6.58). The intracellular bacilli were co-localized with lysosomal-associated membrane protein-1 (LAMP-1) and LAMP-2 in ARPE-19 cells. The transcriptome study of intracellular bacilli showed that most of the upregulated transcripts correspond to the genes encoding the proteins involved in the processes such as adherence (e.g., Rv1759c and Rv1026), invasion (e.g., Rv1971 and Rv0169), virulence (e.g., Rv2844 and Rv0775), and intracellular survival (e.g., Rv1884c and Rv2450c) as well as regulators of various metabolic pathways. Two of the upregulated transcripts (Rv1971, Rv1230c) were also present in the vitreous samples of the IOTB patients. Conclusions:M. tuberculosis is phagocytosed by RPE cells and utilizes these cells for intracellular multiplication with the involvement of late endosomal/lysosomal compartments and alters its transcriptional profile plausibly for its intracellular adaptation and survival. The findings of the present study could be important to understanding the molecular pathogenesis of IOTB with a potential role in the development of diagnostics and therapeutics for IOTB.

Keywords: Mycobacterium tuberculosis; RPE; electron microscopy; intracellular adaptation; intraocular tuberculosis; pathogenesis; transcriptome; vitreous samples.


Figures

Figure 1
Figure 1
Scanning electron microscopy images of uninfected and M. tuberculosis infected ARPE-19 cells. (A) Electron micrograph of uninfected ARPE-19 monolayer cells. (B) The white arrow indicates adherent M. tuberculosis bacilli at 15 min post infection and the inset shows SEM micrographs of in vitro grown M. tuberculosis used for infection. (C) White arrows indicate M. tuberculosis adhering to ARPE-19 cells at 30 min and cell surface changes at the site of attachment of bacilli. The experiment was done in three independent wells and the representative figures are shown.
Figure 2
Figure 2
Transmission electron microscopy images of uninfected and M. tuberculosis infected ARPE-19 cells. (A) Electron micrograph showing a cross-section of uninfected ARPE-19 cells. (B–D) Infected ARPE-19 cells after 0- (B), 1- (C), and 3-dpi (D). The figure (B) in inset represents M. tuberculosis H37Rv cells. Black arrows indicate the vacuolar membrane surrounding the multiple bacilli in ARPE-19 cells. The experiment was done twice and the cells were collected from independent flasks, and the representative figures are shown. dpi, day post infection.
Figure 3
Figure 3
Colony forming units (CFU) and fold CFU of M. tuberculosis in ARPE-19 cells at different time-points after infection. ARPE-19 monolayer cells were infected with H37Rv at MOI 10:1. (A) CFU counts are mean ± standard error mean (SEM). (B) Fold CFU was calculated by dividing the mean CFU at each time-point (1-, 3-, and 5-dpi) by the day 0 CFU. **p < 0.01 and *p < 0.05 in comparison to 0-dpi. Two independent experiments were performed and cells were infected in duplicate for each time-point. dpi, day post-infection.
Figure 4
Figure 4
Percent cytotoxicity caused by M. tuberculosis to ARPE-19 cells. (A) Mean ± SEM O.D. values at 570 nm (A570) of uninfected and infected ARPE-19 cells at different time-points (0-,−1-, 3-, 5-dpi). (B) Cytolysis of cells was quantified using MTT dye at different time-points. *p < 0.05 in comparison to 0- dpi. The percent (%) cytotoxicity was calculated as = (Mean O.D. of control cells - Mean O.D. of infected cells)/Mean O.D. of control cells × 100. dpi, day post infection; SEM, standard error of the mean.
Figure 5
Figure 5
LAMP-1 staining for lysosomal localization of M. tuberculosis in RPE (ARPE-19) cells. Confocal micrographs of uninfected (UI) (A) and infected (I) ARPE-19 cells (MOI 10:1) at 0-dpi (B), 1-dpi (C), and 3-dpi (D) showing staining for (i) M. tuberculosis labeled with PKH26 dye (red channel); (ii) LAMP-1 antibody using secondary FITC-IgG (green channel); (iii) DAPI for nuclei (blue channel). In infected ARPE-19 cells (rows B–D; column iv), white arrowheads show merging of two channels (red and green) and the Pearson's R coefficient for the colocalization of M. tuberculosis with LAMP-1. Zero is no colocalization, and 1 means perfect colocalization. Dpi, day post-infection; UI, uninfected; I, infected.
Figure 6
Figure 6
LAMP-2 staining for lysosomal localization of M. tuberculosis in RPE (ARPE-19) cells. Confocal micrographs of uninfected (UI) (A) and infected (I) ARPE-19 cells (MOI 10:1) at 0-dpi (B), 1-dpi (C), and 3-dpi (D) showing staining for (i) M. tuberculosis labeled with PKH26 dye (red channel); (ii) LAMP-2 antibody using secondary FITC-IgG (green channel); (iii) DAPI for nuclei (blue channel). In infected ARPE-19 cells (rows B–D; column iv), white arrowheads show merging of two channels (red and green) and the Pearson's R coefficient for the colocalization of M. tuberculosis with LAMP-2. Zero is no colocalization, and 1 means perfect colocalization. Dpi, day post-infection; UI, uninfected; I, infected.
Figure 7
Figure 7
Transcriptome analysis of intracellular M. tuberculosis in in vitro model of intraocular tuberculosis. (A) The heat map shows the 2 control samples (in vitro M. tuberculosis as inoculum used during infection; rows 1, 2) and 6 test samples (three biological replicates, each with two technical replicates. Rows 3-5 is biological and row 6-8 is technical set) from 3 independent experiments. (B) Volcano plot shows the upregulated genes (blue boxes), the downregulated genes (red boxes), and the unchanged genes (gray boxes). The x-axis denotes log2 fold change whereas the Y-axis denotes the log10 of p-values. (C) The pie chart shows the percentage of differentially regulated genes in each functional category as per the TubercuList. (D) The table shows the number of genes upregulated and downregulated in each functional category. The transcripts at 2.0-fold change cut-off were considered to be differentially regulated at p < 0.05. To avoid the false positive selection of transcripts, multiple testing correction was performed using Benjamini–Hochberg procedure in Gene Spring software. To check the statistical number of genes differentially regulated in each functional category, Hypergeometric probability (value in parentheses) was applied and bold values indicate the statistically significant at p < 0.05. (E) Validation of microarray data on qRT-PCR by analyzing the relative expression of 9 genes (5 upregulated and 4 downregulated) in two independent experiments (3-dpi), with technical replicates as compared to in vitro grown M. tb H37Rv. 16s rRNA was used as reference gene for normalization. Y-axis values (Log2 fold change) of ≥1 indicate upregulation and values ≤ -1 indicate down-regulation. Each bar represents mean ± SD values for each of the genes with two biological and two technical replicates. *p < 0.05; **p < 0.01 by student's t-test.

References

    1. Agrawal R., Gunasekeran D.V., Grant R., Agarwal A., Kon O.M., Nguyen Q.D., et al. . (2017). Clinical features and outcomes of patients with tubercular uveitis treated with antitubercular therapy in the Collaborative Ocular Tuberculosis Study (COTS)−1. JAMA Ophthalmol. 135:1318. 10.1001/jamaophthalmol.2017.4485 - DOI - PMC - PubMed
    1. Aguilar-Ayala D. A., Tilleman L., Van Nieuwerburgh F., Deforce D., Palomino J. C., Vandamme P., et al. . (2017). The transcriptome of Mycobacterium tuberculosis in a lipid-rich dormancy model through RNAseq analysis. Sci. Rep. 7:17665. 10.1038/s41598-017-17751-x - DOI - PMC - PubMed
    1. Anand P., Chandra N. (2014). Characterizing the pocketome of Mycobacterium tuberculosis and application in rationalizing polypharmacological target selection. Sci. Rep. 3:6356 10.1038/srep06356 - DOI - PMC - PubMed
    1. Arruda S., Bomfim G., Knights R., Huima-Byron T., Riley L. W. (1993). Cloning of an M. tuberculosis DNA fragment associated with entry and survival inside cells. Science 261, 1454–1457. 10.1126/science.8367727 - DOI - PubMed
    1. Ates L. S., van der Woude A. D., Bestebroer J., van Stempvoort G., Musters R. J. P., Garcia-Vallejo J. J., et al. . (2016). The ESX-5 system of pathogenic mycobacteria is involved in capsule integrity and virulence through its substrate PPE10. PLOS Pathog. 12:e1005696. 10.1371/journal.ppat.1005696 - DOI - PMC - PubMed

Publication types