

doi: 10.1039/c8cc06774k.
Dual-modal in vivo fluorescence and photoacoustic imaging using a heterodimeric peptide
Affiliations
- PMID: 30334022
- PMCID: PMC6357226
- DOI: 10.1039/c8cc06774k
Item in Clipboard
Dual-modal in vivo fluorescence and photoacoustic imaging using a heterodimeric peptide
Chem Commun (Camb).
.
Abstract
A heterodimeric peptide labeled with IRDye800 is used to perform dual-modal imaging of human esophageal xenograft tumors in vivo. Fluorescence and photoacoustic images provide complementary visualization of tumor dimensions in planar and sagittal views, respectively, demonstrating promise for targeted cancer diagnosis and staging.
Conflict of interest statement
Conflicts of interest
JC and TDW are inventors on a patent filed by the University of Michigan on the peptide heterodimer presented in this study.
Figures

A) Chemical structure of QRH*-KSP*-E3-IRDye800 is shown. B) PA intensity (0–500 μg/mL) and C) FL emission (5–100 μg/mL) is linear over range of heterodimer concentrations. Inset: PA and FL images of heterodimer in PBS solution at different concentrations. D) Negligible cytotoxicity is seen with heterodimer added to a panel of human OE19, OE21, OE33 and SKBr3 cancer cells for 48 hours at concentrations up to 500 μg/mL.

. Strong fluorescence intensity is observed from QRH*-KSP*-E3-IRDye800 (red) binding to the surface (arrows) of A) SKBr3 cells. Western blot shows B) EGFR and C) HER2 expression by SKBr3, OE21, OE19, and QhTERT cells. D) Quantified results show significantly greater mean (±SD) fluorescence intensity for heterodimer binding to SKBr3 (EGFR+/HER+) cells versus OE21 (EGFR+/HER-), OE19 (EGFR-/HER+), and QhTERT (EGFR-/HER-) cells by paired t-test. Results for each measurement are representative of 3 independent experiments.
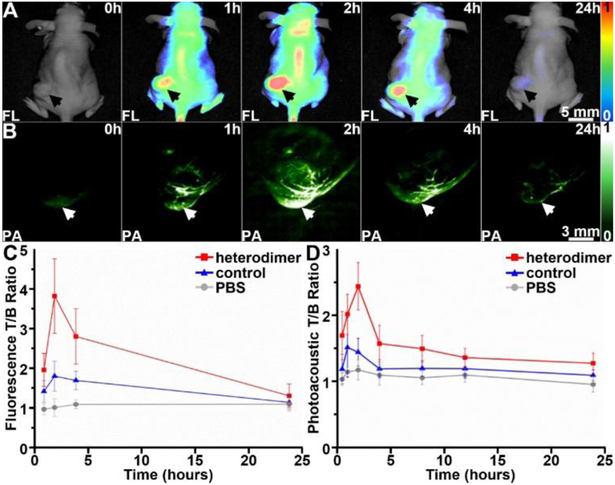
. Representative A) FL and B) PA images are shown of tumor (arrow) at 0 (pre-injection), 1, 2, 4, and 24 hours after intravenous injection of QRH*-KSP*-E3-IRDye800. C) Fluorescence T/B ratio for heterodimer peaks at 2 hours post-injection. Mean (±SD) result for heterodimer (3.89±0.94) is significantly greater than that for control peptide (GGGAGGG )2-E3-IRDye800 (3.89±0.94) and PBS (1.06±0.22), P=6.4×10⁻⁴ and 3.19×10⁻⁵ by unpaired t-test with n=6 mice. D) Photoacoustic T/B ratio for heterodimer also peaks at 2 hours post-injection. Mean result for heterodimer (2.44±0.36) is significantly greater than that for control peptide (1.44±0.21) and PBS (1.17±0.15), P=1.6×10⁻⁴ and 1.26×10⁻⁵.

. A) White light and B) FL images (λex=800 nm) are shown of heterodimer distribution in major organs at 2 hours post-injection. C) Mean (±SD) fluorescence intensity for heterodimer and control peptide is shown from n=6 mice each. Results from tumor are significantly greater for heterodimer versus control by an average of 2.6-fold, P=3.1×10⁻⁴ by unpaired t-test. D) FL intensity from serum of tumor bearing mice injected with heterodimer (300 μM, 150 μL PBS, n=6) is shown over 48 hours. Blood prior to heterodimer injection is shown as control. Quantified results show decrease in relative FL intensity from 90.1 to 1.3% with half-life of ∼3 hours, R2=0.95.

. A) White light image shows location of human esophageal (OE33) xenograft tumor in a nude mouse. B) NIR FL image collected 2 hours after heterodimer injection shows tumor dimensions (red dash) of L×W = 6.4×4.7 mm2. C) Sagittal view of PA image collected along (white dash) line in panel A) shows tumor (yellow dash) highlighted by heterodimer with 4.8 mm (blue) depth and 1.2 cm (red) total depth. D) Ultrasound image confirms tumor structure.

. A) QRH*-KSP*-E3-IRDye800 (red), B) AF568-labeled anti-EGFR (yellow), and C) AF488-labeled anti-HER2 (green) show strong binding to the surface (arrows) of human OE33 xenograft tumor cells. D) Representative histology (H&E) shows boundary between normal and tumor. Heterodimer binding co-localizes with E) anti-EGFR and F) anti-HER2 with ρ=0.45 and 0.62, respectively. G) Quantified results show a significantly greater T/B ratio for the heterodimer (5.0±0.8) than either anti-EGFR (2.5±0.5) or anti-HER2 (3.2±0.8), P=3.4×10⁻¹³ and P=2.6×10⁻⁸ by unpaired t-test. Fluorescence intensities were quantified from a set of 3 boxes with dimensions of 20×20 μm2 placed randomly as shown in panels A-C).
References
MeSH terms
Substances
Grants and funding
LinkOut - more resources
Full Text Sources