

Effects of Ethanol Exposure on the Neurochemical Profile of a Transgenic Mouse Model with Enhanced Glutamate Release Using In Vivo 1H MRS
- PMID: 30334175
- PMCID: PMC6497580
- DOI: 10.1007/s11064-018-2658-9
Effects of Ethanol Exposure on the Neurochemical Profile of a Transgenic Mouse Model with Enhanced Glutamate Release Using In Vivo 1H MRS
Abstract
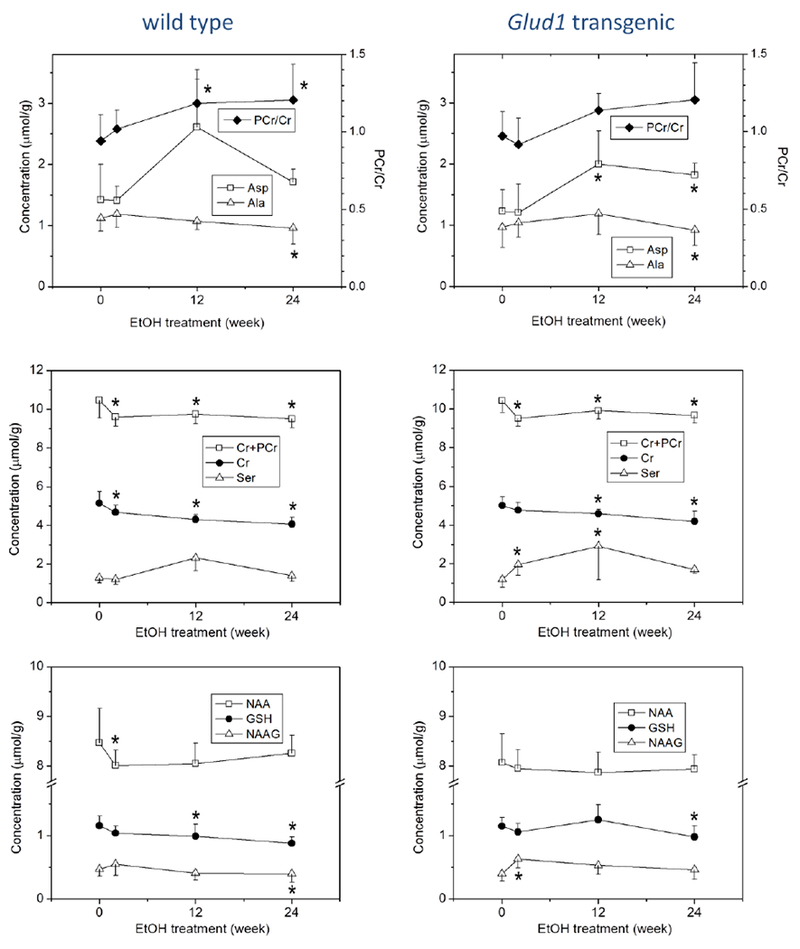
Ethanol (EtOH) intake leads to modulation of glutamatergic transmission, which may contribute to ethanol intoxication, tolerance and dependence. To study metabolic responses to the hyper glutamatergic status at synapses during ethanol exposure, we used Glud1 transgenic (tg) mice that over-express the enzyme glutamate dehydrogenase in brain neurons and release excess glutamate (Glu) in synapses. We measured neurochemical changes in the hippocampus and striatum of tg and wild-type (wt) mice using proton magnetic resonance spectroscopy before and after the animals were fed with diets within which EtOH constituting up to 6.4% of total calories for 24 weeks. In the hippocampus, the EtOH diet led to significant increases in concentrations of EtOH, glutamine (Gln), Glu, phosphocholine (PCho), taurine, and Gln + Glu, when compared with their baseline concentrations. In the striatum, the EtOH diet led to significant increases in concentrations of GABA, Gln, Gln + Glu, and PCho. In general, neurochemical changes were more pronounced in the striatum than the hippocampus in both tg and wt mice. Overall neurochemical changes due to EtOH exposure were very similar in tg and wt mice. This study describes time courses of neurochemical profiles before and during chronic EtOH exposure, which can serve as a reference for future studies investigating ethanol-induced neurochemical changes.
Keywords: Enhanced glutamate release; Ethanol exposure; Glud1 transgenic mice; Magnetic resonance spectroscopy.
Figures


Similar articles
-
Increases in anterograde axoplasmic transport in neurons of the hyper-glutamatergic, glutamate dehydrogenase 1 (Glud1) transgenic mouse: Effects of glutamate receptors on transport.J Neurochem. 2024 May;168(5):719-727. doi: 10.1111/jnc.16035. Epub 2023 Dec 20. J Neurochem. 2024. PMID: 38124277 Free PMC article.
-
Metabolism changes during aging in the hippocampus and striatum of glud1 (glutamate dehydrogenase 1) transgenic mice.Neurochem Res. 2014;39(3):446-55. doi: 10.1007/s11064-014-1239-9. Epub 2014 Jan 21. Neurochem Res. 2014. PMID: 24442550 Free PMC article.
-
Serial exposure to ethanol drinking and methamphetamine enhances glutamate excitotoxicity.J Neurochem. 2019 Dec;151(6):749-763. doi: 10.1111/jnc.14861. Epub 2019 Oct 15. J Neurochem. 2019. PMID: 31478210 Free PMC article.
-
Glutamate metabolites in treatment resistant schizophrenia: A meta-analysis and systematic review of 1H-MRS studies.Psychiatry Res Neuroimaging. 2020 Jun 30;300:111080. doi: 10.1016/j.pscychresns.2020.111080. Epub 2020 Apr 3. Psychiatry Res Neuroimaging. 2020. PMID: 32279055
-
How adaptation of the brain to alcohol leads to dependence: a pharmacological perspective.Alcohol Res Health. 2008;31(4):310-39. Alcohol Res Health. 2008. PMID: 20729980 Free PMC article. Review.
Cited by
-
Increases in anterograde axoplasmic transport in neurons of the hyper-glutamatergic, glutamate dehydrogenase 1 (Glud1) transgenic mouse: Effects of glutamate receptors on transport.J Neurochem. 2024 May;168(5):719-727. doi: 10.1111/jnc.16035. Epub 2023 Dec 20. J Neurochem. 2024. PMID: 38124277 Free PMC article.
-
Potential Link Between Exercise and N-Methyl-D-Aspartate Glutamate Receptors in Alcohol Use Disorder: Implications for Therapeutic Strategies.Psychol Res Behav Manag. 2024 Jun 14;17:2363-2376. doi: 10.2147/PRBM.S462403. eCollection 2024. Psychol Res Behav Manag. 2024. PMID: 38895648 Free PMC article. Review.
-
A Novel Sulfonamide, 4-FS, Reduces Ethanol Drinking and Physical Withdrawal Associated With Ethanol Dependence.Int J Mol Sci. 2020 Jun 21;21(12):4411. doi: 10.3390/ijms21124411. Int J Mol Sci. 2020. PMID: 32575871 Free PMC article.
-
Brain ethanol metabolism by astrocytic ALDH2 drives the behavioural effects of ethanol intoxication.Nat Metab. 2021 Mar;3(3):337-351. doi: 10.1038/s42255-021-00357-z. Epub 2021 Mar 22. Nat Metab. 2021. PMID: 33758417 Free PMC article.
References
-
- Krystal JH, Petrakis IL, Mason G, Trevisan L, D’Souza DC (2003) N-methyl-D-aspartate glutamate receptors and alcoholism: reward, dependence, treatment, and vulnerability. Pharmacol Ther 99:79–94 - PubMed
-
- Tabakoff B, Hoffman PL (1995) Pharmacological Effects of Ethanol on the Nervous System. CRC Press, New Year
-
- Tsai G, Gastfriend DR, Coyle JT (1995) The glutamatergic basis of human alcoholism. Am J Psychiatry 152:332–340 - PubMed
-
- Allan AM, Harris RA (1987) Acute and chronic ethanol treatments alter GABA receptor-operated chloride channels. Pharmacology Biochemistry and Behavior 27:665–670 - PubMed
-
- Lovinger DM, White G, Weight FF (1989) Ethanol inhibits NMDA-activated ion current in hippocampal neurons. Science 243:1721–1724 - PubMed
MeSH terms
Substances
Grants and funding
LinkOut - more resources
Full Text Sources
Medical
Miscellaneous
