Fine Particulate Matter-Induced Exacerbation of Allergic Asthma via Activation of T-cell Immunoglobulin and Mucin Domain 1
- PMID: 30334531
- PMCID: PMC6202600
- DOI: 10.4103/0366-6999.243551
Fine Particulate Matter-Induced Exacerbation of Allergic Asthma via Activation of T-cell Immunoglobulin and Mucin Domain 1
Abstract
Background: Fine particulate matter (PM2.5) exacerbates airway inflammation and hyperreactivity in patients with asthma, but the mechanism remains unclear. The aim of this study was to observe the effects of prolonged exposure to high concentrations of PM2.5on the pathology and airway hyperresponsiveness (AHR) of BALB/c mice undergoing sensitization and challenge with ovalbumin (OVA) and to observe the effects of apoptosis and T-cell immunoglobulin and mucin domain 1 (TIM-1) in this process.
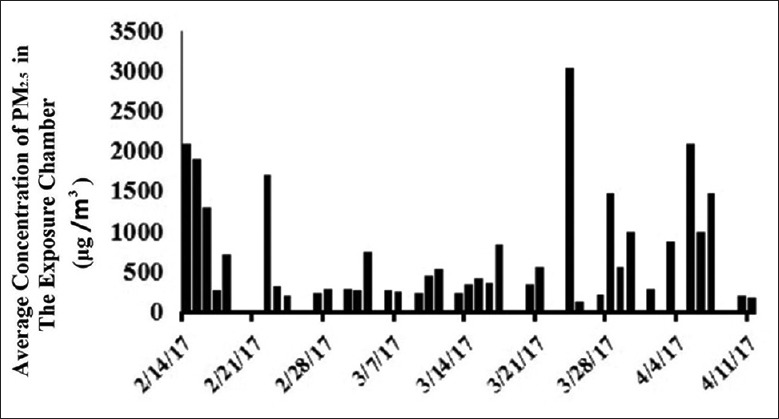
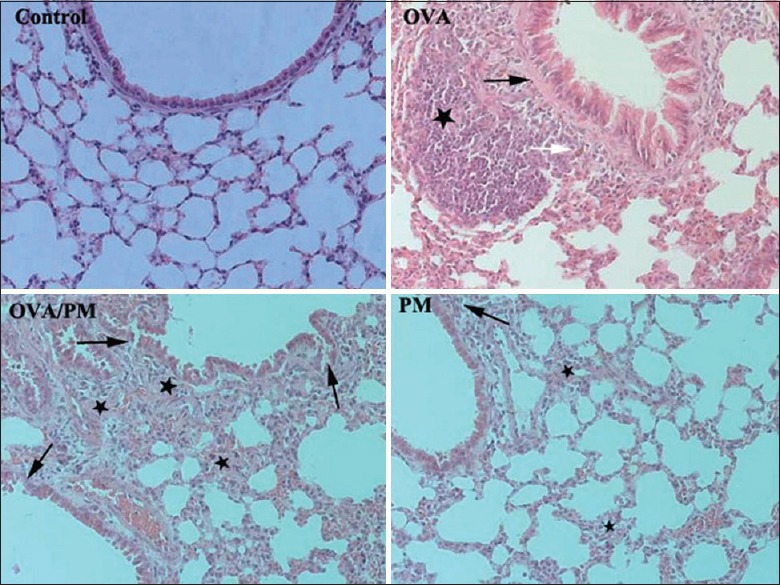
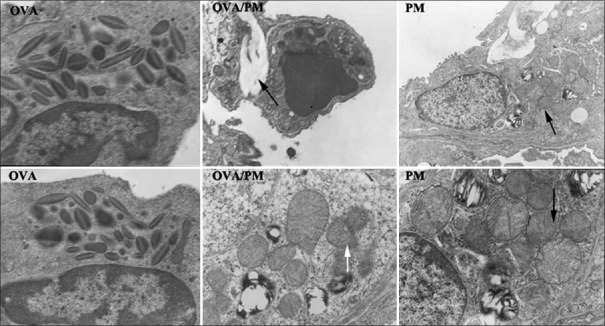
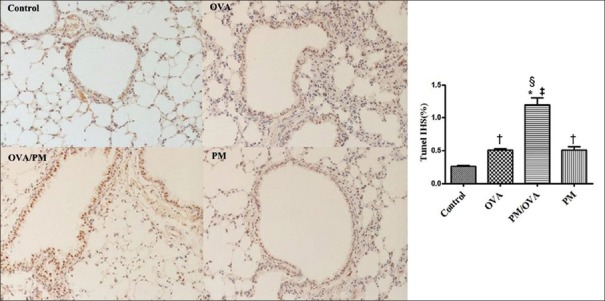
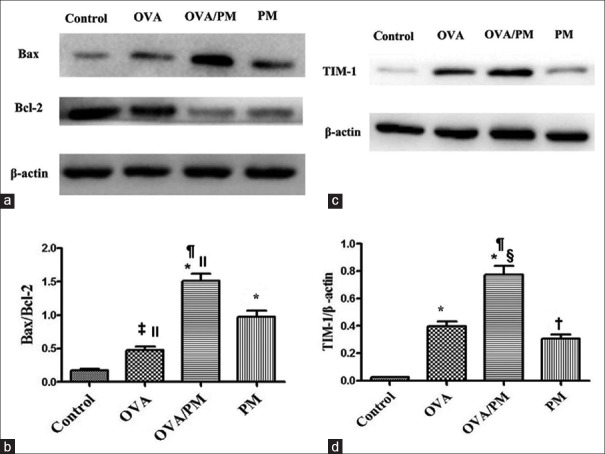
Methods: Forty female BALB/c mice were divided into four groups: control group, OVA group, OVA/PM group, and PM group (n = 10 in each group). Mice in the control group were exposed to filtered clean air. Mice in the OVA group were sensitized and challenged with OVA. Mice in the OVA/PM group were sensitized and challenged as in the OVA group and then exposed to PM2.5for 4 h per day and 5 days per week for a total of 8 weeks using a nose-only "PM2.5online enrichment system" in The Second Hospital of Hebei Medical University. Mice in the PM group were exposed to the PM2.5 online enrichment system only. AHR was detected. Bronchoalveolar lavage fluid (BALF) was collected for cell classification. The levels of interleukin-4 (IL-4), IL-5, and IL-33 in BALF were measured using enzyme-linked immunosorbent assay. Changes in histological structures were examined by light microscopy, and changes in ultramicrostructures were detected by electron microscopy. Apoptosis was determined by terminal deoxynucleotidyl transferase-mediated dUTP nick end-labeling (TUNEL) assay in the lung tissues. Western blotting and immunohistochemistry were utilized to analyze the expression of Bcl-2, Bax, and TIM-1 in the lungs.
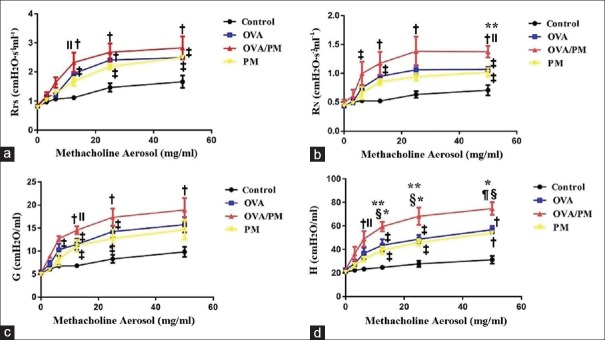
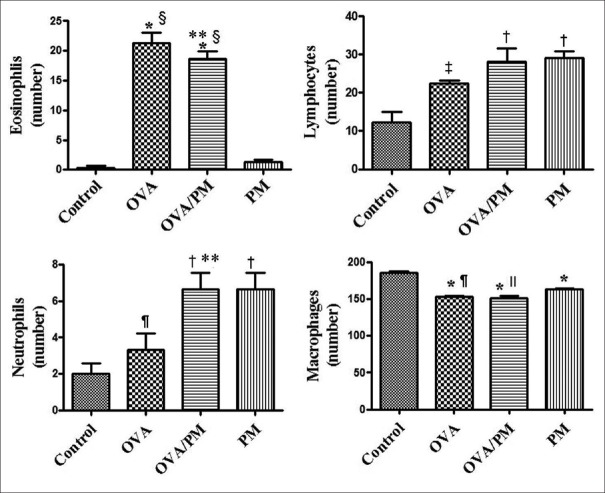
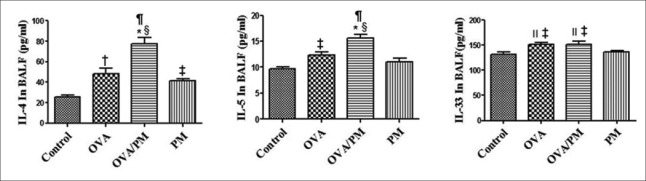
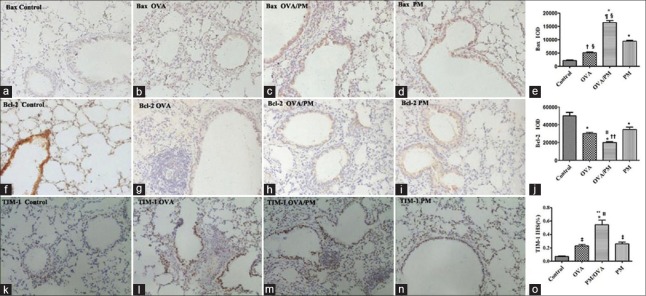
Results: The results showed that AHR in the OVA/PM group was significantly more severe than that in the OVA and PM groups (P < 0.05). AHR in the PM group was also considerably more severe than that in the control group (P < 0.05). The BALF of OVA/PM group (28.00 ± 6.08 vs. 12.33 ± 4.51, t = 4.631, P = 0.002) and PM group (29.00 ± 3.00 vs. 12.33 ± 4.51, t = 4.927, P = 0.001) had more lymphocytes than the BALF of the control group. The number of neutrophils in the BALF of the OVA/PM group (6.67 ± 1.53 vs. 3.33 ± 1.53, t = 2.886, P = 0.020) and PM group (6.67 ± 1.53 vs. 3.33 ± 1.53, t = 2.886, P = 0.020) was much higher than those in the BALF of OVA group (P < 0.05). TUNEL assays showed that the number of apoptotic cells in the OVA/PM group was significantly higher than that in the OVA group (Tunel immunohistochemical scores [IHS%], 1.20 ± 0.18 vs. 0.51 ± 0.03, t = 8.094, P < 0.001) and PM group (Tunel IHS%, 1.20 ± 0.18 vs. 0.51 ± 0.09, t = 8.094, P < 0.001), and that the number of apoptotic cells in the PM group was significantly higher than that in the control group (Tunel IHS%, 0.51 ± 0.09 vs. 0.26 ± 0.03, t = 2.894, P = 0.020). The concentrations of IL-4 (77.44 ± 11.19 vs. 48.02 ± 10.02 pg/ml, t = 4.595, P = 0.002) and IL-5 (15.65 ± 1.19 vs. 12.35 ± 0.95 pg/ml, t = 3.806, P = 0.005) and the Bax/Bcl-2 ratio (1.51 ± 0.18 vs. 0.48 ± 0.10, t = 9.654, P < 0.001) and TIM-1/β-actin ratio (0.78 ± 0.11 vs. 0.40 ± 0.06, t = 6.818, P < 0.001) in the OVA/PM group were increased compared to those in the OVA group. The concentrations of IL-4 (77.44 ± 11.19 vs. 41.47 ± 3.40 pg/ml, t = 5.617, P = 0.001) and IL-5 (15.65 ± 1.19 vs. 10.99 ± 1.40 pg/ml, t = 5.374, P = 0.001) and the Bax/Bcl-2 ratio (1.51 ± 0.18 vs. 0.97 ± 0.16, t = 5.000, P = 0.001) and TIM-1/β-actin ratio (0.78 ± 0.11 vs. 0.31 ± 0.06, t = 8.545, P < 0.001) in the OVA/PM group were increased compared to those in the PM group. The concentration of IL-4 (41.47 ± 3.40 vs. 25.46 ± 2.98 pg/ml, t = 2.501, P = 0.037) and the Bax/Bcl-2 ratio (0.97 ± 0.16 vs. 0.18 ± 0.03, t = 7.439, P < 0.001) and TIM-1/β-actin ratio (0.31 ± 0.06 vs. 0.02 ± 0.01, t = 5.109, P = 0.001) in the PM group were also higher than those in the control group.
Conclusions: Exacerbated AHR associated with allergic asthma caused by PM2.5is related to increased apoptosis and TIM-1 activation. These data might provide insights into therapeutic targets for the treatment of acute exacerbations of asthma induced by PM2.5.
T细胞免疫球蛋白域1的激活介导细颗粒物引起的小鼠过敏性哮喘 摘要 背景:细颗粒物(PM<SUP>2.5</SUP>)会加剧哮喘患者的气道炎症和高反应性,但这种机制仍不确定。本研究的目的是观察长期暴露于高浓度的PM<SUP>2.5</SUP>对于已经采用卵清蛋白(OVA)致敏的小鼠的病理、气道高反应性的影响,同时观察细胞凋亡和T细胞免疫球蛋白域1(TIM-1)在这个过程中的作用。 方法:四十只BALB/c小鼠被分为4组:对照组,OVA组,OVA/PM组,PM组(n = 10/组)。对照组吸入清洁空气,OVA组采用OVA致敏和激发,OVA/PM组采用OVA同样的方法致敏和激发,同时将小鼠固定在PM<SUP>2.5</SUP>在线富集系统的口鼻暴露器上,每日4小时,每周5天,连续8周,吸入富集的PM<SUP>2.5</SUP>,此项操作在中国河北省石家庄市河北医科大学第二医院进行。PM组仅仅给予吸入富集的PM<SUP>2.5</SUP>。随后进行气道高反应性 (AHR)检测,收集肺泡灌洗液(BALF)进行细胞计数。采用酶联免疫法检测BALF中的白细胞介素4 (interleukin-4, IL-4),白细胞介素5 (interleukin-5, IL-5)和白细胞介素33 (interleukin-33, IL-33)的浓度。用光学显微镜检查肺组织学结构,用电镜观察其超微结构。采用脱氧核苷酸末端转移酶介导的dUTP 缺口末端标记(TUNEL) 法检测肺组织中的凋亡细胞。利用免疫印迹和免疫组织化学检测肺组织中的Bcl-2, Bax和TIM-1表达。 结果:结果显示OVA/PM组小鼠气道反应性相对于OVA组和PM组明显升高(P < 0.05),而仅暴露PM<SUP>2.5</SUP>组小鼠气道高反应相对于对照组也有明显升高(P < 0.05)。OVA/PM组(28.00 ± 6.08 vs 12.33 ± 4.51, t = 4.631, P = 0.002) 和PM组(29.00 ± 3.00 vs 12.33 ± 4.51, t = 4.927, P = 0.001)的BALF中淋巴细胞数量较对照组显著增高(P < 0.05). OVA/PM组 (6.67 ± 1.53 vs 3.33 ± 1.53, t = 2.886, P = 0.020) 和PM组 (6.67 ± 1.53 vs 3.33±1.53, t = 2.886, P = 0.020) 的BALF中中性粒细胞数量较OVA 组(P < 0.05)比较显著升高。TUNEL检测显示OVA/PM组凋亡细胞显著高于OVA组(Tunel immunohistochemical scores [IHS%], 1.20 ± 0.18 vs 0.51 ± 0.03, t = 8.094, P < 0.001) 和 PM组 (Tunel IHS%, 1.20 ± 0.18 vs 0.51 ± 0.09, t = 8.094, P < 0.001),PM组凋亡细胞显著高于对照组(Tunel IHS%, 0.51 ± 0.09 vs 0.26 ± 0.03, t = 2.894, P = 0.020)。IL-4(77.44 ± 11.19 vs 48.02 ± 10.02 pg/ml, t = 4.595, P = 0.002) 和IL-5 (15.65 ± 1.19 vs 12.35 ± 0.95 pg/ml, t = 3.806, P = 0.005)的浓度和Bax/Bcl-2比(1.51 ± 0.18 vs 0.48 ± 0.10, t = 9.654, P < 0.001) 和TIM-1/IM-1) 4比 (0.78 ± 0.11 vs 0.40 ± 0.06, t = 6.818, P < 0.001) 在OVA/PM 组较OVA组比较显著增加。IL-4(77.44 ± 11.19 vs 41.47 ± 3.40 pg/ml, t = 5.617, P = 0.001)和IL-5 (15.65 ± 1.19 vs 10.99 ± 1.40 pg/ml, t = 5.374, P = 0.001) 的浓度和Bax/Bcl-2比(1.51 ± 0.18 vs 0.97 ± 0.16,t = 5.000, P = 0.001)和TIM-1/IM-1001比 (0.78 ± 0.11 vs 0.31 ± 0.06, t = 8.545, P < 0.001)在OVA/PM 组较PM组比较显著增加。IL-4 (41.47 ± 3.40 vs 25.46 ± 2.98 pg/ml, t = 2.501, P = 0.037)浓度和Bax/Bcl-2比 (0.97 ± 0.16 vs 0.18 ± 0.03, t = 7.439, P < 0.001 )和TIM-1/IM-1 )9比(0.31 ± 0.06 vs 0.02 ± 0.01, t = 5.109, P = 0.001)在PM组较对照组比较显著增加。 结论:PM<SUP>2.5</SUP>导致过敏性哮喘气道高反应性加剧与凋亡增加及T细胞免疫球蛋白域1(TIM-1)激活有关,这可能为治疗PM<SUP>2.5</SUP>诱发的哮喘急性加重提供治疗靶点。.
Keywords: Apoptosis; Asthma; Fine Particulate Matter; T-cell Immunoglobulin and Mucin Domain 1.
Conflict of interest statement
There are no conflicts of interest
Figures
Similar articles
-
PM2.5 induces airway hyperresponsiveness and inflammation via the AhR pathway in a sensitized Guinea pig asthma-like model.Toxicology. 2022 Jan 15;465:153026. doi: 10.1016/j.tox.2021.153026. Epub 2021 Nov 10. Toxicology. 2022. PMID: 34774659
-
Unveiling the potent effect of vitamin D: harnessing Nrf2/HO-1 signaling pathways as molecular targets to alleviate urban particulate matter-induced asthma inflammation.BMC Pulm Med. 2024 Jan 25;24(1):55. doi: 10.1186/s12890-024-02869-2. BMC Pulm Med. 2024. PMID: 38273268 Free PMC article.
-
Fine particulate matter (PM2.5) enhances allergic sensitization in BALB/c mice.J Toxicol Environ Health A. 2017;80(4):197-207. doi: 10.1080/15287394.2016.1222920. Epub 2017 May 11. J Toxicol Environ Health A. 2017. PMID: 28494199 Free PMC article.
-
The costimulatory role of TIM molecules.Immunol Rev. 2009 May;229(1):259-70. doi: 10.1111/j.1600-065X.2009.00772.x. Immunol Rev. 2009. PMID: 19426227 Free PMC article. Review.
-
T cell Ig and mucin domain proteins and immunity.J Immunol. 2010 Mar 15;184(6):2743-9. doi: 10.4049/jimmunol.0902937. J Immunol. 2010. PMID: 20200285 Free PMC article. Review.
Cited by
-
Mechanisms of Particles in Sensitization, Effector Function and Therapy of Allergic Disease.Front Immunol. 2020 Jun 30;11:1334. doi: 10.3389/fimmu.2020.01334. eCollection 2020. Front Immunol. 2020. PMID: 32714326 Free PMC article. Review.
-
PM2.5-induced pulmonary inflammation via activating of the NLRP3/caspase-1 signaling pathway.Environ Toxicol. 2021 Mar;36(3):298-307. doi: 10.1002/tox.23035. Epub 2020 Sep 30. Environ Toxicol. 2021. PMID: 32996690 Free PMC article.
-
Effects of environmental exposure to iron powder on healthy and elastase-exposed mice.Sci Rep. 2024 Apr 21;14(1):9134. doi: 10.1038/s41598-024-59573-8. Sci Rep. 2024. PMID: 38644380 Free PMC article.
-
Toxicological Effects of Fine Particulate Matter (PM2.5): Health Risks and Associated Systemic Injuries-Systematic Review.Water Air Soil Pollut. 2023;234(6):346. doi: 10.1007/s11270-023-06278-9. Epub 2023 May 24. Water Air Soil Pollut. 2023. PMID: 37250231 Free PMC article. Review.
-
Effect of VAChT reduction on lung alterations induced by exposure to iron particles in an asthma model.J Inflamm (Lond). 2024 Jul 3;21(1):24. doi: 10.1186/s12950-024-00399-6. J Inflamm (Lond). 2024. PMID: 38961398 Free PMC article.
References
-
- Cheng MH, Chen CC, Chiu HF, Yang CY. Fine particulate air pollution and hospital admissions for asthma: A case-crossover study in Taipei. J Toxicol Environ Health A. 2014;77:1075–83. doi: 10.1080/15287394.2014.922387. - PubMed
-
- Tsai SS, Chiu HF, Liou SH, Yang CY. Short-term effects of fine particulate air pollution on hospital admissions for respiratory diseases: A case-crossover study in a tropical city. J Toxicol Environ Health A. 2014;77:1091–101. doi: 10.1080/15287394.2014.922388. - PubMed
-
- Zhang X, Zhong W, Meng Q, Lin Q, Fang C, Huang X, et al. Ambient PM2.5 exposure exacerbates severity of allergic asthma in previously sensitized mice. J Asthma. 2015;52:785–94. doi: 10.3109/02770903.2015.1036437. - PubMed
MeSH terms
Substances
LinkOut - more resources
Full Text Sources
Medical
Research Materials