. 2020 Jan;40(1):23-34.
doi: 10.1177/0271678X18803951. Epub 2018 Oct 18.

Non-invasive monitoring of longitudinal changes in cerebral hemodynamics in acute ischemic stroke using BOLD signal delay

Affiliations

Non-invasive monitoring of longitudinal changes in cerebral hemodynamics in acute ischemic stroke using BOLD signal delay

Ahmed A Khalil et al. J Cereb Blood Flow Metab. 2020 Jan.

Abstract

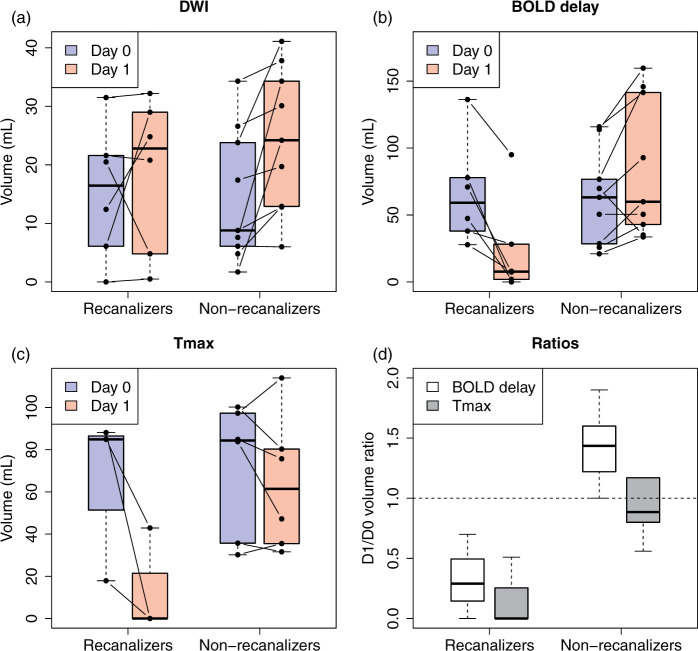
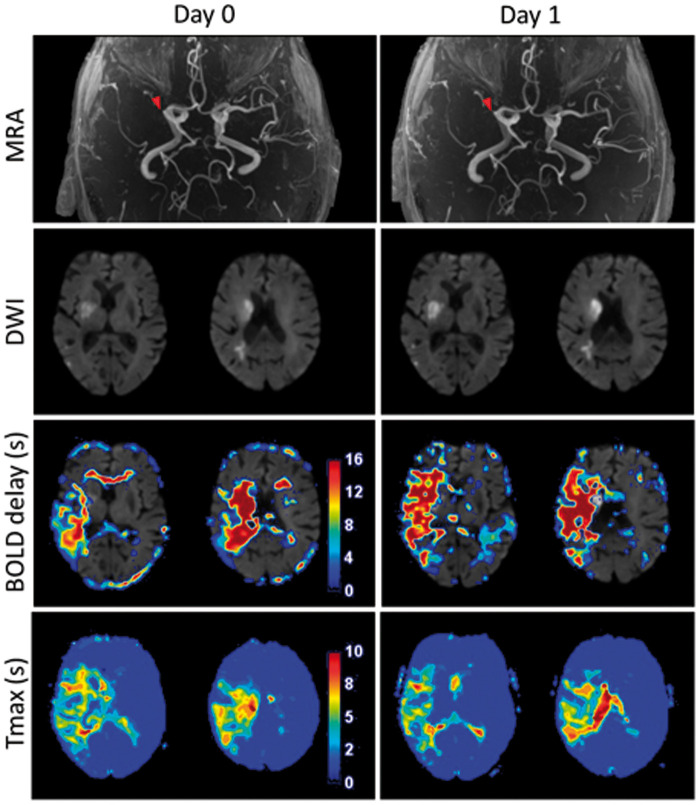
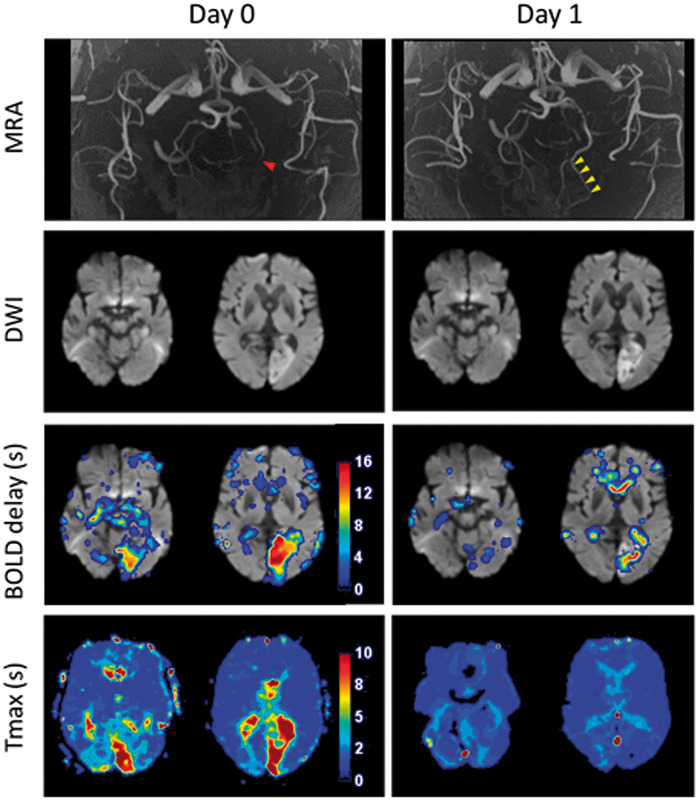
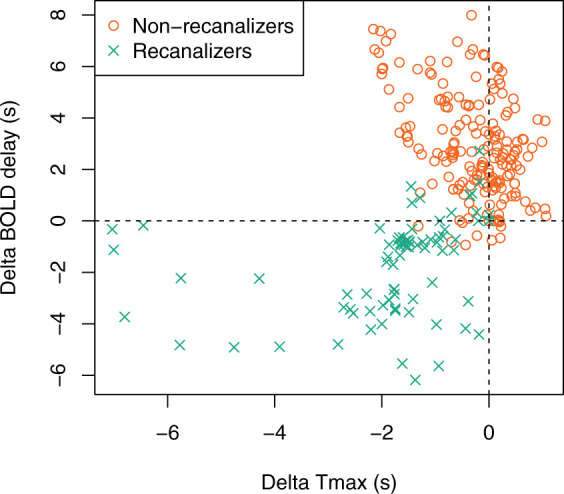
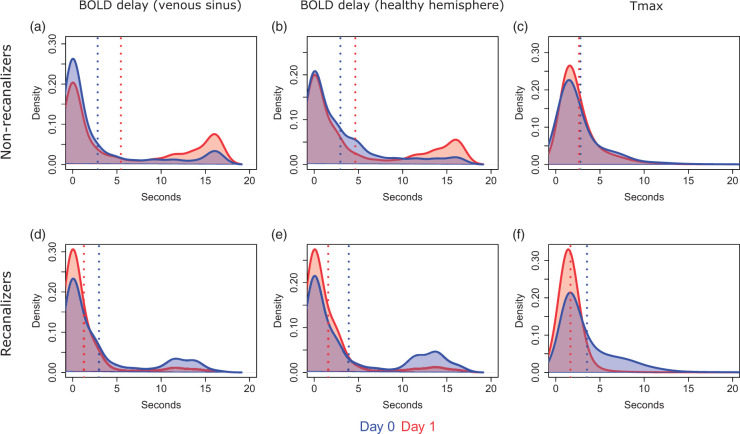
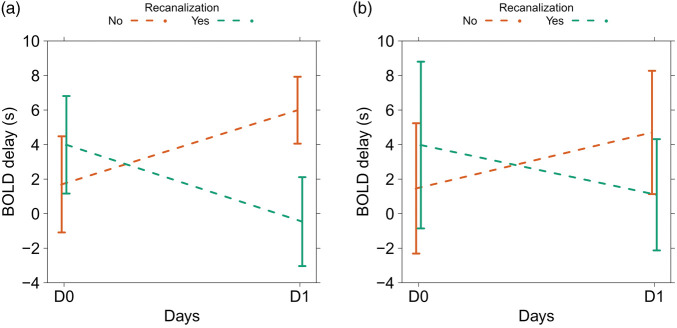
Relative delays in blood-oxygen-level-dependent (BOLD) signal oscillations can be used to assess cerebral perfusion without using contrast agents. However, little is currently known about the utility of this method in detecting clinically relevant perfusion changes over time. We investigated the relationship between longitudinal BOLD delay changes, vessel recanalization, and reperfusion in 15 acute stroke patients with vessel occlusion examined within 24 h of symptom onset (D0) and one day later (D1). We created BOLD delay maps using time shift analysis of resting-state functional MRI data and quantified perfusion lesion volume changes (using the D1/D0 volume ratio) and severity changes (using a linear mixed model) over time. Between baseline and follow-up, BOLD delay lesions shrank (median D1/D0 ratio = 0.2, IQR = 0.03-0.7) and BOLD delay severity decreased (b = -4.4 s) in patients with recanalization, whereas they grew (median D1/D0 ratio = 1.47, IQR = 1.1-1.7) and became more severe (b = 4.3 s) in patients with persistent vessel occlusion. Clinically relevant changes in cerebral perfusion in early stroke can be detected using BOLD delay, making this non-invasive method a promising option for detecting tissue at risk of infarction and monitoring stroke patients following recanalization therapy.

Keywords: Blood-oxygen-level-dependent delay; acute stroke; blood flow; perfusion; resting-state functional MRI.


Figures

Figure 1.
Figure 1.
Boxplots (central line; median, box; first and third quartiles, whiskers; ± 1.5*IQR) showing manually delineated DWI (a), BOLD delay (b), and Tmax (c) lesion volumes on day 0 and day 1 according to recanalization status. Changes in perfusion lesion volume in patients who did not recanalize (n = 6) and those who did recanalize (n = 3) at follow-up (d). D1/D0 volume ratios > 1 indicate perfusion lesion growth and values < 1 indicate shrinkage. Note that (a) and (b) show the entire sample, while (c) and (d) only show patients who also received DSC-MRI.
Figure 2.
Figure 2.
Example of a patient in the non-recanalized group, scanned 2 h after stroke symptom onset (Day 0). Diffusion-weighted imaging (DWI) shows a right-sided middle cerebral artery infarct with an M1 occlusion visible on the MR angiography (MRA) and a corresponding perfusion deficit on both the Tmax and BOLD delay maps. There was no recanalization after intravenous thrombolysis (Day 1). The Tmax lesion remained stable (D1/D0 volume ratio = 1.17). while the BOLD delay lesion grew (D1/D0 volume ratio = 1.47).
Figure 3.
Figure 3.
Example patient showing complete recanalization. This patient was scanned 2.5 h after symptom onset and shows a left posterior cerebral artery infarct. The initial P3 occlusion (Day 0, red arrowhead) completely recanalized (Day 1, yellow arrowheads), accompanied by recovery of the Tmax and BOLD delay lesions. A small amount of BOLD delay persisting within the infarct itself is seen on the Day 1 map.
Figure 4.
Figure 4.
Scatter plot showing changes in mean Tmax and BOLD delay values within ROIs in the affected vascular territory between days 0 and 1 according to recanalization status. Each point is the mean value within a ROI corresponding to the area covered by the affected vascular territory on each slice. Positive change values indicate worsening of perfusion severity from day 0 to day 1, and negative values indicate improvement. In recanalizers, ROIs where Tmax improves are associated with improvement in BOLD delay. However, in most ROIs in the non-recanalizers, Tmax changes little but BOLD delay severity worsens substantially.
Figure 5.
Figure 5.
Kernel density plots showing the distribution of perfusion deficit severity values (pooled across all patients who received both DSC-MRI and rsfMRI scans) on day 0 and day 1 in the affected vascular territory according to recanalization status. Blue and red vertical lines indicate the mean perfusion deficit severity in the sample on days 0 and 1, respectively.
Figure 6.
Figure 6.
Effects plots showing the predicted mean BOLD delay values (derived from the venous sinus reference in A and the healthy hemisphere reference in B) from the linear mixed models for the interaction between the study timepoints (D0 and D1) and the presence or absence of recanalization. The bars indicate 95% confidence intervals. The plots show that recanalization is associated with a decrease in BOLD delay severity, while persistent vessel occlusion is associated with an increase in BOLD delay severity in areas of infarct growth.

References

    1. Lv Y, Margulies DS, Cameron Craddock R, et al.Identifying the perfusion deficit in acute stroke with resting-state functional magnetic resonance imaging. Ann Neurol 2013; 73: 136–139. - PubMed
    1. Amemiya S, Kunimatsu A, Saito N, et al.Cerebral hemodynamic impairment: assessment with resting-state functional MR imaging. Radiology 2014; 270: 548–555. - PubMed
    1. Khalil AA, Ostwaldt AC, Nierhaus T, et al.Relationship between changes in the temporal dynamics of the blood-oxygen-level-dependent signal and hypoperfusion in acute ischemic stroke. Stroke 2017; 48: 925–931. - PubMed
    1. Christen T, Jahanian H, Ni WW, et al.Noncontrast mapping of arterial delay and functional connectivity using resting-state functional MRI: a study in moyamoya patients. J Magn Reson Imaging 2015; 41: 424–430. - PMC - PubMed
    1. Siegel JS, Snyder AZ, Ramsey L, et al.The effects of hemodynamic lag on functional connectivity and behavior after stroke. J Cereb Blood Flow Metab 2016; 36: 2162–2176. - PMC - PubMed

Publication types