. 2020 Jan;40(1):100-115.
doi: 10.1177/0271678X18803948. Epub 2018 Oct 18.

Altered hemodynamics contribute to local but not remote functional connectivity disruption due to glioma growth

Affiliations

Altered hemodynamics contribute to local but not remote functional connectivity disruption due to glioma growth

Inema E Orukari et al. J Cereb Blood Flow Metab. 2020 Jan.

Abstract

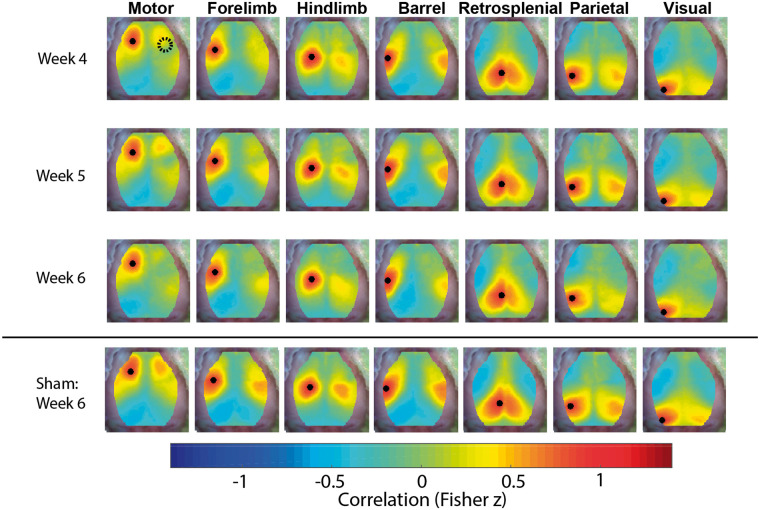
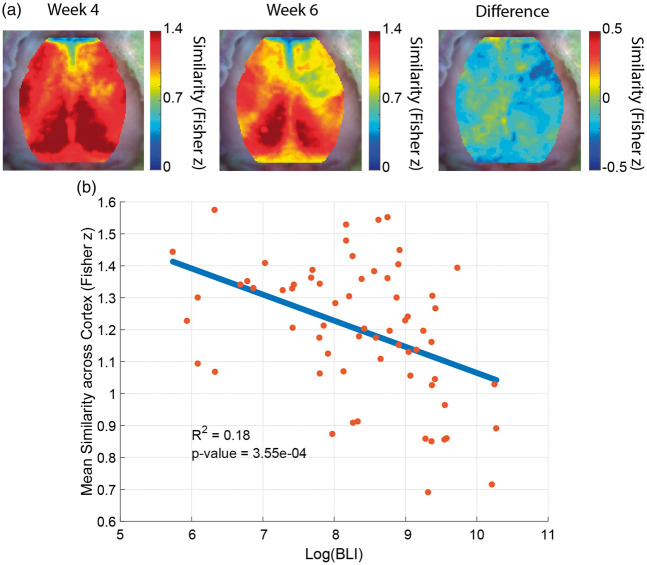
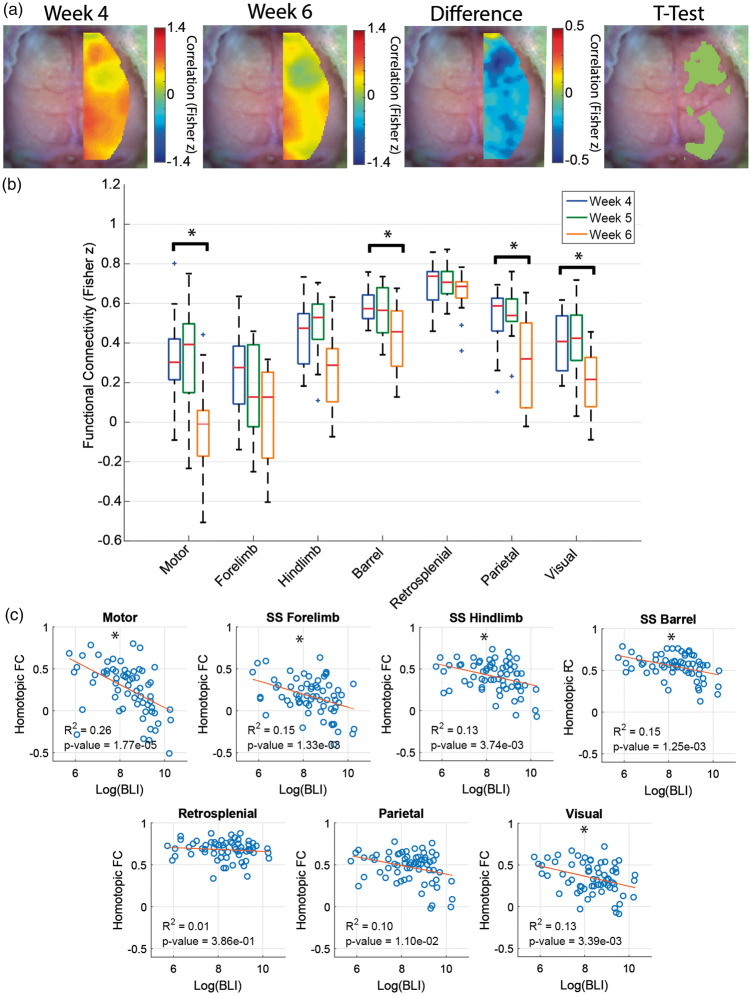
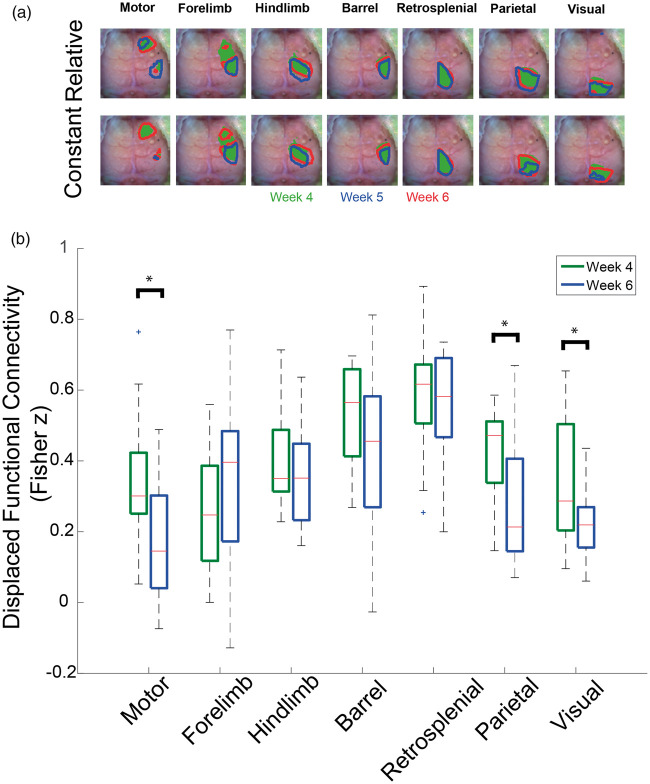
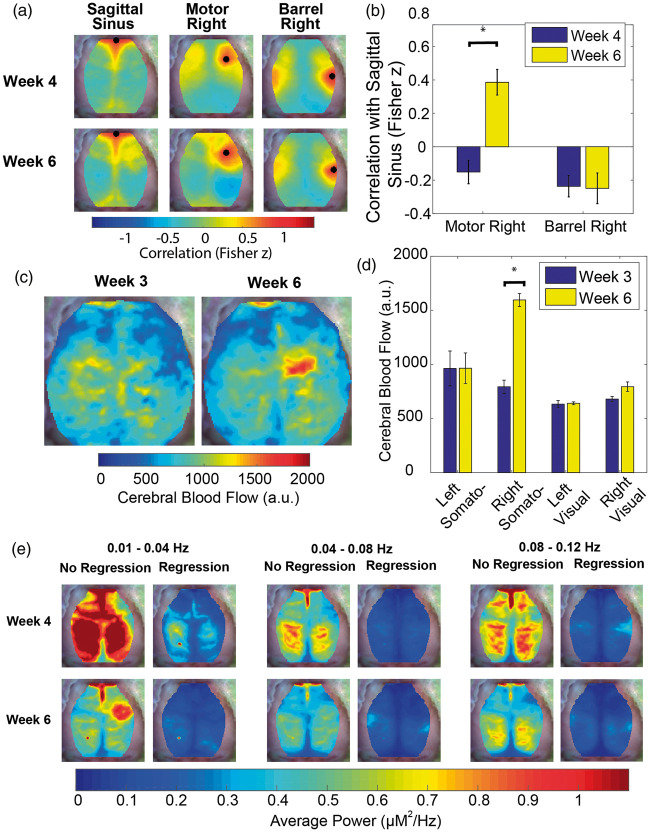
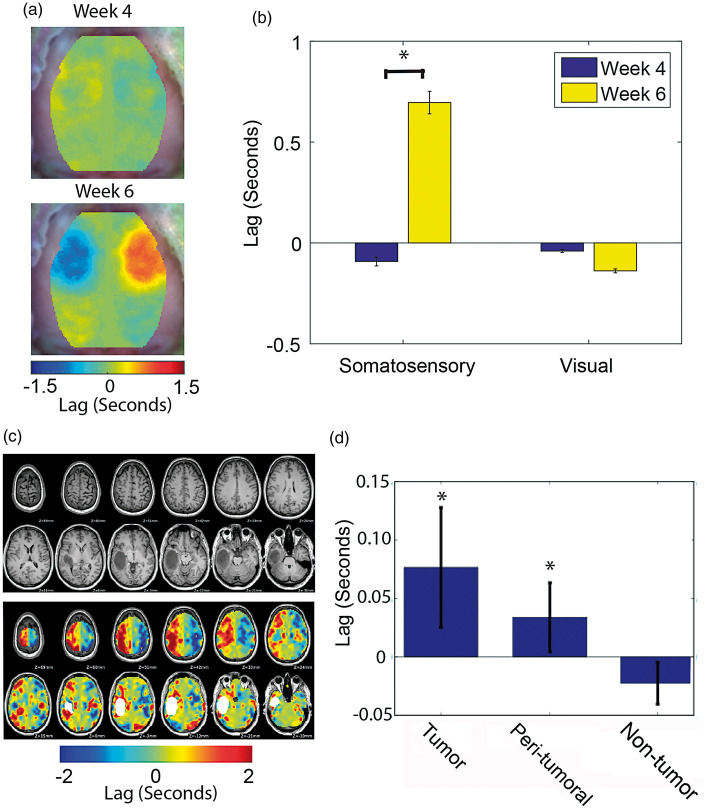
Glioma growth can cause pervasive changes in the functional connectivity (FC) of brain networks, which has been associated with re-organization of brain functions and development of functional deficits in patients. Mechanisms underlying functional re-organization in brain networks are not understood and efforts to utilize functional imaging for surgical planning, or as a biomarker of functional outcomes are confounded by the heterogeneity in available human data. Here we apply multiple imaging modalities in a well-controlled murine model of glioma with extensive validation using human data to explore mechanisms of FC disruption due to glioma growth. We find gliomas cause both local and distal changes in FC. FC changes in networks proximal to the tumor occur secondary to hemodynamic alterations but surprisingly, remote FC changes are independent of hemodynamic mechanisms. Our data strongly implicate hemodynamic alterations as the main driver of local changes in measurements of FC in patients with glioma.

Keywords: Functional connectivity; glioma; hemodynamic lags; mouse model; neurovascular uncoupling.


Figures

Figure 1.
Figure 1.
FC maps. Group-average functional connectivity maps constructed with oxygenated hemoglobin traces of mice injected with glioma cells (n = 13) for the fourth, fifth and sixth weeks post-injection. Maps demonstrate a loss of symmetry over time. Group-average functional connectivity maps of mice with sham injections (n = 20) for the sixth week post-injection are included for reference. Only functional connectivity maps for seeds in the left hemisphere contralateral to the injection site are displayed (the black dots indicate the location of the seed used to construct the functional connectivity map).
Figure 2.
Figure 2.
FC similarity metric. (a) Group-average similarity maps of mice injected with glioma cells (n = 13). The fourth week post-injection map, the sixth week post-injection map, and the difference map between the fourth and sixth weeks post-injection are displayed. The maps show a global decrease in similarity over time. (b) Scatter plot of the mean similarity across the cortex of individual gliomas at all time point versus the logarithm of bioluminescence signal. Each mouse is represented by more than one point. There is a significant anti-correlation between mean similarity and tumor burden.
Figure 3.
Figure 3.
Homotopic connectivity metrics. (a) Group-average homotopic connectivity maps of mice injected with glioma cells (n = 13) for different weeks. The fourth week post-injection map, the sixth week post-injection map, and the difference and t-test (paired, p < 0.05, FDR corrected) maps between the fourth and sixth weeks post-injection are displayed. The maps show that functional connectivity in some regions of the brain is more disrupted than others. (b) Quantification of group-average homotopic connectivity of glioma-injected mice (n = 13) for seven homotopic seed pairs within our field of view (paired, *indicates p < 0.05, Bonferroni corrected). (c) Scatter plot of homotopic connectivity of glioma mice at all time points versus the logarithm of bioluminescence signal. Each mouse is represented by more than one point. Homotopic connectivity pairs in specific brain regions show significant anti-correlations with tumor burden (*indicates p < 0.05, Bonferroni corrected).
Figure 4.
Figure 4.
MRI and OIS co-registration, tumor and disrupted functional connectivity overlay, and histology. (a) A maximum intensity projection of T2-weighted MRIs along the ventrodorsal direction was used to project MRIs onto the same plane as OIS, and affine transform was used to co-register the maximum intensity projection image and OIS using fiducial landmarks (the green and red dots indicate lambda and the intersection of the coronal and sagittal sutures, respectively). Images were then normalized and thresholded at 0.35. (b) Frequency map of brain tumors (n = 6) that were segmented from co-registered MRIs in sixth week post injection (dotted line indicates field of view of OIS). (c) Map of disrupted functional connectivity constructed by performing a pixel-wise t-test between fourth and sixth week post-injection group-average homotopic connectivity maps (n = 13, paired, p < 0.05, FDR corrected). (d) Overlay of the non-zero tumor frequency pixels masked by the FOV of OIS and map of disrupted functional connectivity. Overlay image demonstrates local and remote regions of functional connectivity disruption. (e) Hematoxylin and eosin stain of representative mouse injected with glioma cells in the eigth week post-injection (MRI provides orientation). Histology indicates that the tumors are well-circumscribed, localized to the injection site, and absent from the region of remote functional connectivity disruption (arrow indicates the remote region of functional connectivity disruption corresponding to the visual cortex).
Figure 5.
Figure 5.
Functional connectivity contours and displaced functional connectivity. (a) Group-average functional connectivity contours of 50% of relative and constant maximums (n = 13) for different weeks. Relative functional connectivity contours use a threshold based on 50% of the maximum of each week. Constant functional connectivity contours use a threshold based on 50% of the maximum at week 4 post-injection (Green = Week 4, Red = Week 5, and Blue = Week 6). The contours indicate that some functional regions are displaced, and even split, by the tumor. Constant maximum contours show that functional regions decrease in area over time. (b) Quantification of the group-average displaced functional connectivity (n = 13) for week 4 and week 6 post injection (*indicates p < 0.05). Displaced functional connectivity is calculated by using the relative functional connectivity contours as regions of interest and averaging all the Fisher z correlation values within each contour. Only the motor and visual functional regions have decreased magnitude when accounting for displacement.
Figure 6.
Figure 6.
Vascular dysregulation within the tumor region. (a) Group-average correlation maps (n = 13) of sagittal sinus, motor right and barrel right seeds at week 4 and week 6 post-injection. (b) Quantification of the group-average correlation (n = 13) between the sagittal sinus seed and both the motor right and barrel right seeds (*indicates p < 0.05). This graph indicates that regions near the injection site become correlated with systemic vascular fluctuations over time. (c) Group-average cerebral blood flow maps for a subset of mice (n = 3) at week 3 and week 6 post injection. (d) Quantification of the group-average cerebral blood flow value (n = 3) for the left and right somatosensory hindlimb and left and right visual seeds at week 3 and week 6 post-injection indicates that tumor blood flow increases over time. (e) Group-average power maps (n = 13) for three frequency bands with and without regression of the signal from a vascular feature (sagittal sinus seed) at week 4 and week 6 post-injection demonstrate that average power maps decrease in magnitude with time and with regression of the sagittal sinus. However, average power in the tumor region increases in the 0.01 Hz–0.04 Hz frequency band when there is no regression of the sagittal sinus. The power in the tumor region is affected more profoundly by sagittal sinus regression than other regions indicating that the hemodynamic in this region is likely being driven by vascular fluctuations of systemic origin.
Figure 7.
Figure 7.
Homotopic lags in mice and in humans. (a) Group-average homotopic lag maps for mice injected with glioma cells (n = 13) at week 4 and week 6 post injection. (b) Quantification of the group-average homotopic lag (n = 13) for the somatosensory forelimb and visual seeds (*indicates p < 0.05). These data indicate that murine tumor hemodynamics lag behind the homotopic brain region. (c) Structural MRIs and homotopic lags for a representative human case. (d) Quantification of the group-average homotopic lag (n = 27) for the tumor, peri-tumoral, and non-tumor brain regions (*indicates p < 0.05). Tumor and peri-tumoral regions, but not the non-tumor region, exhibit significant lags compared to their homotopic regions.

References

    1. Ghinda DC, Wu J-S, Duncan NW, et al. How much is enough – Can resting state fMRI provide a demarcation for neurosurgical resection in glioma?. Neurosci Biobehav Rev 2018; 84: 245–261. - PubMed
    1. Otten ML, Mikell CB, Youngerman BE, et al. Motor deficits correlate with resting state motor network connectivity in patients with brain tumours. Brain 2012; 135: 1017–1026. - PMC - PubMed
    1. Maesawa S, Bagarinao E, Fujii M, et al. Evaluation of resting state networks in patients with gliomas: connectivity changes in the unaffected side and its relation to cognitive function. PLoS ONE 2015; 10(2): e0118072. 10.1371/journal.pone.0118072. - DOI - PMC - PubMed
    1. Zhang D, Johnston JM, Fox MD, et al. Preoperative sensorimotor mapping in brain tumor patients using spontaneous fluctuations in neuronal activity imaged with fMRI: initial experience. Neurosurgery 2009; 65: 226–236. - PMC - PubMed
    1. Biswal B, Yetkin FZ, Haughton VM, et al. Functional connectivity in the motor cortex of resting human brain using echo-planar MRI. Magn Reson Med 1995; 34: 537–541. - PubMed

Publication types

LinkOut - more resources