. 2019 Jan;40(1):41-51.
doi: 10.1097/MNM.0000000000000931.

Clinical usefulness of 99mTc-HYNIC-TOC, 99mTc(V)-DMSA, and 99mTc-MIBI SPECT in the evaluation of pituitary adenomas

Affiliations

Clinical usefulness of 99mTc-HYNIC-TOC, 99mTc(V)-DMSA, and 99mTc-MIBI SPECT in the evaluation of pituitary adenomas

Vladimir R Vukomanovic et al. Nucl Med Commun. 2019 Jan.

Abstract

Background: The aim of this study was to evaluate the behavioral uptake and ability to diagnose pituitary adenoma (PA) using tumor-seeking radiopharmaceuticals, and to provide a semiquantitative analysis of tracer uptake in the pituitary region.

Patients and methods: The study included 33 (13 hormonally active and 20 nonfunctioning) patients with PA and 45 control participants without pituitary involvement. All patients (n=78) underwent single photon emission computed tomography (SPECT) imaging with technetium-99m-labeled hydrazinonicotinyl-tyr-octreotide (Tc-HYNIC-TOC), dimercaptosuccinic acid (Tc(V)-DMSA) and hexakis-2-methoxyisobutylisonitrile (Tc-MIBI). A semiquantitative analysis of abnormal uptake was carried out by drawing identical regions of interest over the pituitary area and the normal brain on one transverse section that shows the lesion most clearly. The pituitary uptake to normal brain uptake (P/B) ratio was calculated in all cases.

Results: The result of this study confirms that the SPECT semiquantitative method, with all three tracers, showed statistically significant differences between the PA group and the controls. However, Tc-HYNIC-TOC scintigraphy could have the highest diagnostic yield because of the smallest overlap between the P/B ratios between adenoma versus nonadenoma participants (the receiver operating characteristic curve P/B ratio cut-off value was 13.08). In addition, only Tc-MIBI SPECT have the diagnostic potential to detect secreting PAs, with statistically significant differences between groups (P<0.001), with an receiver operating characteristic curve P/B ratio cut-off value of 16.72.

Conclusion: A semiquantitative analysis of increased focal tracer uptake in the sellar area showed that Tc-HYNIC-TOC is a highly sensitive and reliable tumor-seeking agent for detecting PA, whereas Tc-MIBI SPECT is a highly sensitive and specific method in differentiating hormone-secreting pituitary tumor.


Figures
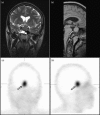
Fig. 1
Fig. 1
Sagittal T2W-postcontrast (a) and coronal T1W-postcontrast (b) MRI in patients with pituitary adenoma (arrow). 99mTc-HYNIC-TOC SPECT sagittal (a) and coronal (b) images at the same patient: focal somatostatin-avid tracer uptake is the sellar area (arrow) with a P/B ratio of 31.3 confirming the diagnosis of an adenoma. P/B, pituitary uptake to normal brain uptake; SPECT, single photon emission computed tomography; 99mTc-HYNIC-TOC, technetium-99m-labeled EDDA-hydrazinonicotinyl-tyr3-octreotide.
Fig. 2
Fig. 2
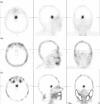
Transverse, sagittal, and coronal slices of the acquired SPECT, postprocessing using the iterative reconstruction (OSEM) method using 99mTc-HYNIC-TOC (a), 99mTc(V)-DMSA (b), and 99mTc-MIBI (c) in the same patient. An ROI was drawn on the transversal image around the tumor, whereas a mirror ROI was drawn above the sella turcica not attached to the choroid plexus. ROI, region-of-interest; SPECT, single photon emission computed tomography; 99mTc-HYNIC-TOC, technetium-99m-labeled EDDA-hydrazinonicotinyl-tyr3-octreotide; 99mTc-MIBI, technetium-99m-hexakis-2-methoxyisobutylisonitrile.
Fig. 3
Fig. 3
Distribution of P/B ratios in the three studied groups showing a statistically significant difference (Mann–Whitney U-test) between pituitary adenomas (n=33) and the control group (n=45). P/B, pituitary uptake to normal brain uptake.
Fig. 4
Fig. 4
Distribution of P/B ratios in the three studied groups revealing statistically significant difference (ANOVA, post-hoc analysis) only with 99mTc-MIBI SPECT between functioning (n=13) and nonfunctioning pituitary adenomas (n=20). ANOVA, analysis of variance; P/B, pituitary uptake to normal brain uptake; 99mTc-MIBI, technetium-99m-hexakis-2-methoxyisobutylisonitrile.
Fig. 5
Fig. 5
Summary ROC curves of diagnostic accuracy of 99mTc-HYNIC-TOC, 99mTc(V)-DMSA, and 99mTc-MIBI SPECT for distinguishing pituitary adenoma from nonadenomas. ROC, receiver operating characteristic; 99mTc-HYNIC-TOC, technetium-99m-labeled EDDA-hydrazinonicotinyl-tyr3-octreotide; 99mTc-MIBI, technetium-99m-hexakis-2-methoxyisobutylisonitrile.
Fig. 6
Fig. 6
Summary ROC curves of diagnostic accuracy of 99mTc-HYNIC-TOC, 99mTc(V)-DMSA, and 99mTc-MIBI SPECT for distinguishing functioning from nonfunctioning pituitary adenomas. ROC, receiver operating characteristic; SPECT, single photon emission computed tomography; 99mTc-HYNIC-TOC, technetium-99m-labeled EDDA-hydrazinonicotinyl-tyr3-octreotide; 99mTc-MIBI, technetium-99m-hexakis-2-methoxyisobutylisonitrile.

References

    1. Molitch ME. Diagnosis and treatment of pituitary adenomas: a review. JAMA 2017; 317:516–524. - PubMed
    1. Syro LV, Rotondo F, Ramirez A, Di Ieva A, Sav MA, Restrepo LM, et al. Progress in the diagnosis and classification of pituitary adenomas. Front Endocrinol 2015; 6:97. - PMC - PubMed
    1. Lake MG, Krook LS, Cruz SV. (2013) Pituitary adenomas: an overview. Am Fam Physician 2013; 88:319–327. - PubMed
    1. Melmed S. Pituitary tumors. Endocrinol Metab Clin North Am 2015; 44:1–9. - PMC - PubMed
    1. Melmed S. Pituitary medicine from discovery to patient-focused outcomes. J Clin Endocrinol Metab 2016; 101:769–777. - PMC - PubMed

Substances