. 2019 Jan 8;47(D1):D774-D779.
doi: 10.1093/nar/gky922.

The mouse Gene Expression Database (GXD): 2019 update

Affiliations

The mouse Gene Expression Database (GXD): 2019 update

Constance M Smith et al. Nucleic Acids Res. .

Abstract

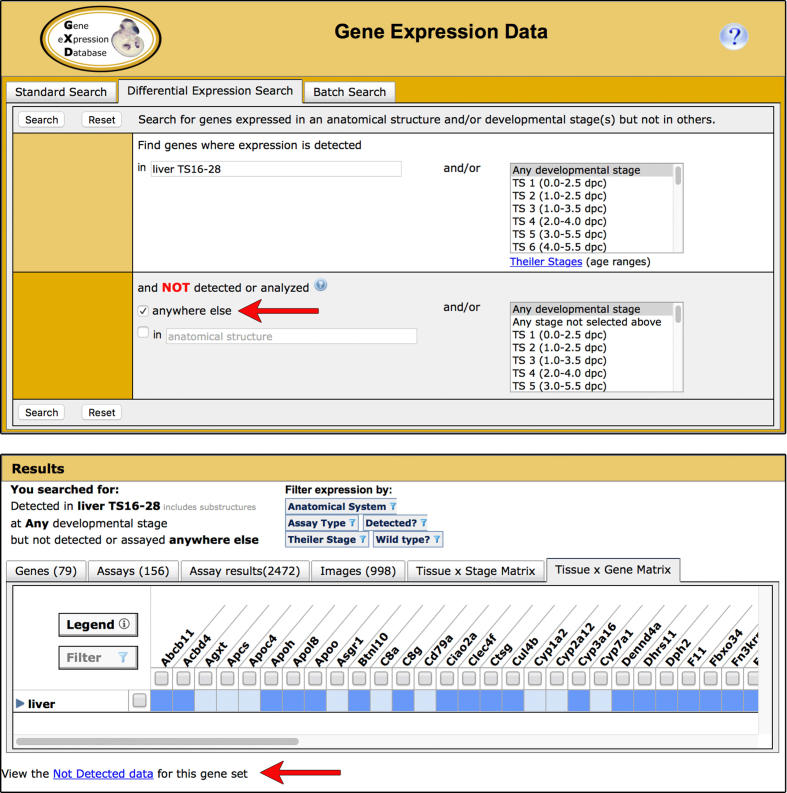
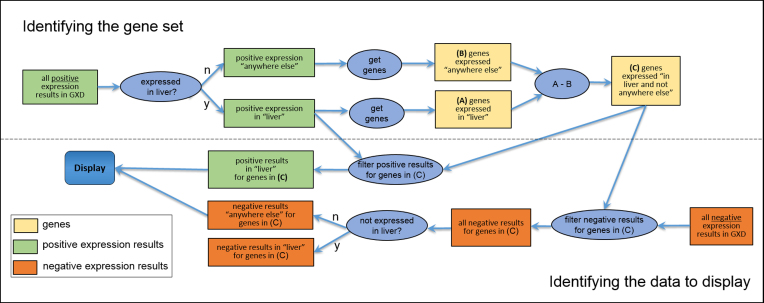
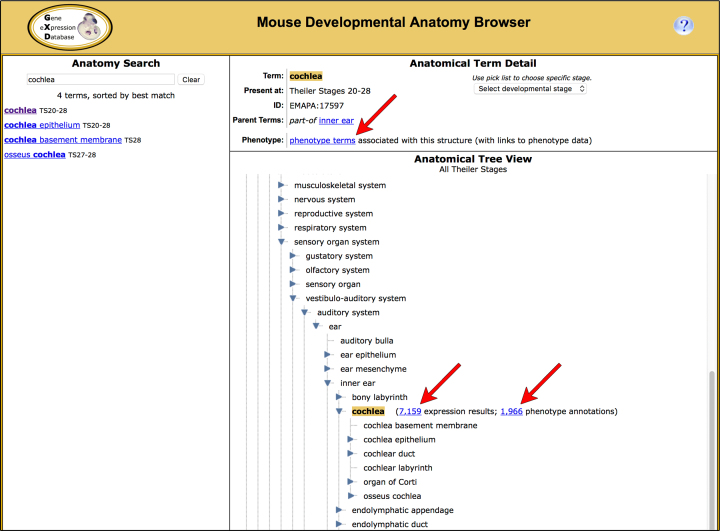
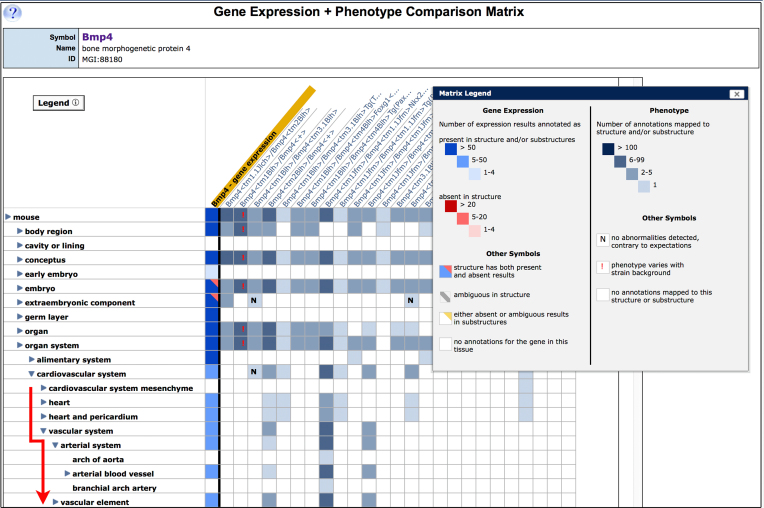
The mouse Gene Expression Database (GXD) is an extensive, well-curated community resource freely available at www.informatics.jax.org/expression.shtml. Covering all developmental stages, GXD includes data from RNA in situ hybridization, immunohistochemistry, RT-PCR, northern blot and western blot experiments in wild-type and mutant mice. GXD's gene expression information is integrated with the other data in Mouse Genome Informatics and interconnected with other databases, placing these data in the larger biological and biomedical context. Since the last report, the ability of GXD to provide insights into the molecular mechanisms of development and disease has been greatly enhanced by the addition of new data and by the implementation of new web features. These include: improvements to the Differential Gene Expression Data Search, facilitating searches for genes that have been shown to be exclusively expressed in a specified structure and/or developmental stage; an enhanced anatomy browser that now provides access to expression data and phenotype data for a given anatomical structure; direct access to the wild-type gene expression data for the tissues affected in a specific mutant; and a comparison matrix that juxtaposes tissues where a gene is normally expressed against tissues, where mutations in that gene cause abnormalities.


Figures

Figure 1.
Figure 1.
The ability to search for genes exclusively expressed in specified anatomical structures and/or developmental stages has been added to the Differential Gene Expression Data Search (upper). The structure and/or stages in which expression has been observed are entered in the upper section of the form. The lower section of the form is used to search for the absence of expression, either by entering structures and/or stages or by selecting the new ‘not detected or analyzed anywhere else’ box (arrow). If you choose the ‘not anywhere else’ option, your search will return a list of genes whose detected (positive) gene expression annotations are limited to the specified structure and its substructures and/or stages; there are no positive annotations to other structures and/or stages. This gene list is displayed in the Tissue-by-Gene Matrix tab of our multi-tabbed search return (lower). Genes on this list may have not detected (negative) gene expression annotations to the structures/stages that are included in the ‘not anywhere else’ domain. To view these negative annotations, click the ‘Not Detected data’ link below the matrix (arrow). To access the supporting data, click in the colored cells of the matrix. The gene list can be downloaded using the Export features found on the Genes tab of the search return.
Figure 2.
Figure 2.
Conceptual diagram of the expressed ‘here’ and ‘not anywhere else’ search and display. This diagram explains what the user sees when using the Differential Gene Expression Data Search to find genes expressed in the liver and ‘not anywhere else’. In this example, ‘here’ is ‘liver,’ but it could be any combination of structure and/or stage(s). Answering the user’s query involves two distinct parts: first, finding the genes that satisfy the constraint (left-to-right flow in the upper portion of the diagram) and second, gathering/organizing the appropriate data for display (right-to-left flow in the lower portion). To find the genes, we consider only positive expression results; i.e. the genes ‘expressed in liver and not anywhere else’ are the genes where there is evidence of expression in the liver or its substructures and no evidence of expression in any other structure [box (C) at top right]. GXD also annotates negative expression results when the authors specifically state that expression was not found in certain tissues or stages. Because such data are far sparser than positive results and because accounting for them greatly complicates the constraint semantics, we leave them out of the calculation of the gene set and simply add them into the display (bottom tier) as corroborating evidence for lack of expression ‘anywhere else.’ Note that this diagram is a conceptual rendering only; the actual implementation is backed by Solr indexes and is much more efficient.
Figure 3.
Figure 3.
The Mouse Developmental Anatomy Browser allows users to search for anatomical structures and to retrieve the expression and phenotype data associated with these structures. The Tree View section of the browser (lower right) allows users to explore the anatomical hierarchy. Anatomy terms are displayed in the context of their parents and substructures. Links beside the selected term (arrows) allow for the retrieval of the expression and phenotype data associated with these structures and their substructures. The Term Detail section of the browser (upper right) displays the term, the developmental stage range during which it is present, and its parent terms. If the term is mapped to MP terms, a link to the MP browser will be present (arrow), leading to a listing of the mapped MP terms and associated phenotype data. Conversely, the MP browser provides, in its Term Detail section, links to mapped anatomical structures that lead to associated expression data (not shown).
Figure 4.
Figure 4.
The Gene Expression + Phenotype Comparison Matrix enables users to compare gene expression and phenotype data for a given gene. The first column (gold header) summarizes the wild-type expression pattern of the gene. The color of matrix cells in the column indicates the type and number of expression annotations for each tissue; the conventions are defined in the matrix legend (inset). Alleles of the gene are displayed in subsequent columns. The tissues where each allele has phenotypic effects are indicated by the presence of colored matrix cells; the cells get progressively darker as the number of phenotype annotations increases. The default matrix display is a relatively high-level anatomy overview, but users can interactively explore the anatomy hierarchy using the blue toggles (▸ or ▾) to expand and collapse the tree; in the figure, the cardiovascular system node has been expanded (red line). To access the supporting data, click in the colored cells of the matrix.

References

    1. Ringwald M., Baldock R., Bard J., Kaufman M., Eppig J.T., Richardson J.E., Nadeau J.H., Davidson D.. A database for mouse development. Science. 1994; 265:2033–2034. - PubMed
    1. Ringwald M., Mangan M.E., Eppig J.T., Kadin J.A., Richardson J.E. GXD: a gene expression database for the laboratory mouse . The gene expression database group. Nucleic Acids Res. 1999; 27:106–112. - PMC - PubMed
    1. Smith C.L., Blake J.A., Kadin J.A., Richardson J.E., Bult C.J. the Mouse Genome Database Group . Mouse Genome Database (MGD)-2018: knowledgebase for the laboratory mouse. Nucleic Acids Res. 2018; 46:D836–D842. - PMC - PubMed
    1. Smith C.M., Finger J.H., Hayamizu T.F., McCright I.J., Xu J., Eppig J.T., Kadin J.A., Richardson J.E., Ringwald M.. GXD: a community resource of mouse Gene Expression Data. Mamm. Genome. 2015; 26:314–324. - PMC - PubMed
    1. Drabkin H.J., Christie K.R., Dolan M.E., Hill D.P., Ni L., Sitnikov D., Blake J.A.. Application of comparative biology in GO functional annotation: the mouse model. Mamm. Genome. 2015; 26:574–583. - PMC - PubMed

Publication types