. 2019 Apr;15(4):631-651.
doi: 10.1080/15548627.2018.1535292. Epub 2018 Nov 5.

Trehalose induces autophagy via lysosomal-mediated TFEB activation in models of motoneuron degeneration

Affiliations

Trehalose induces autophagy via lysosomal-mediated TFEB activation in models of motoneuron degeneration

Paola Rusmini et al. Autophagy. 2019 Apr.

Abstract

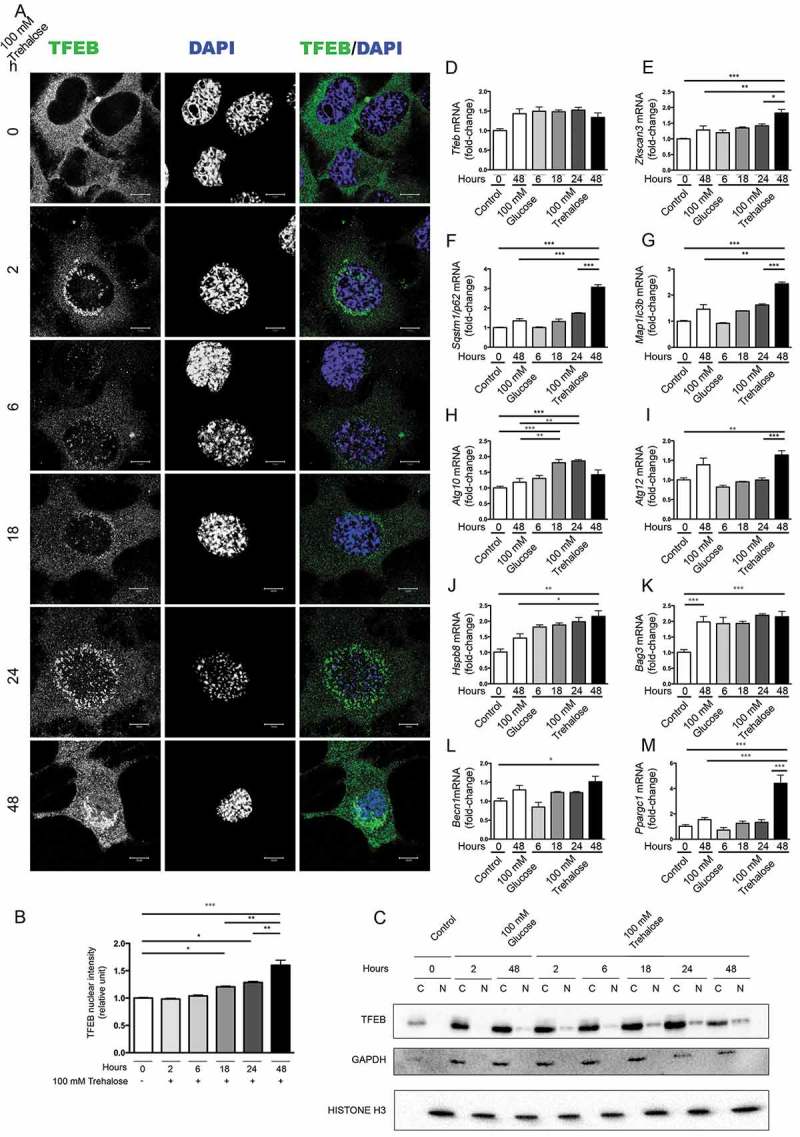
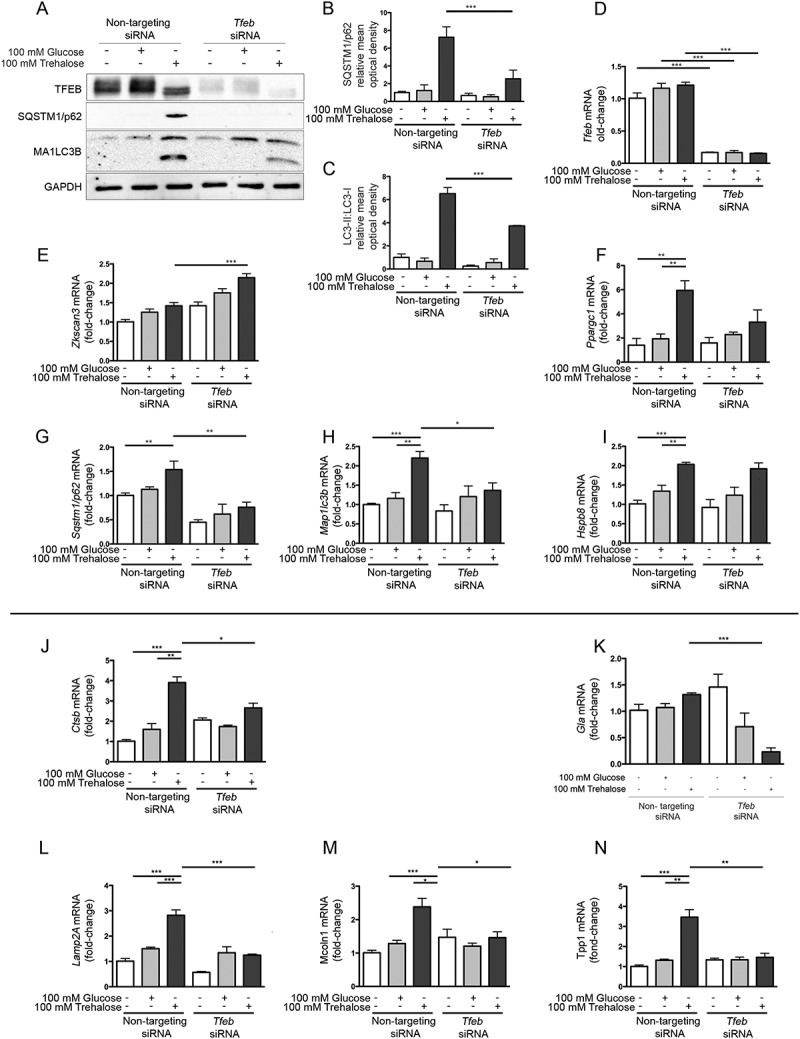
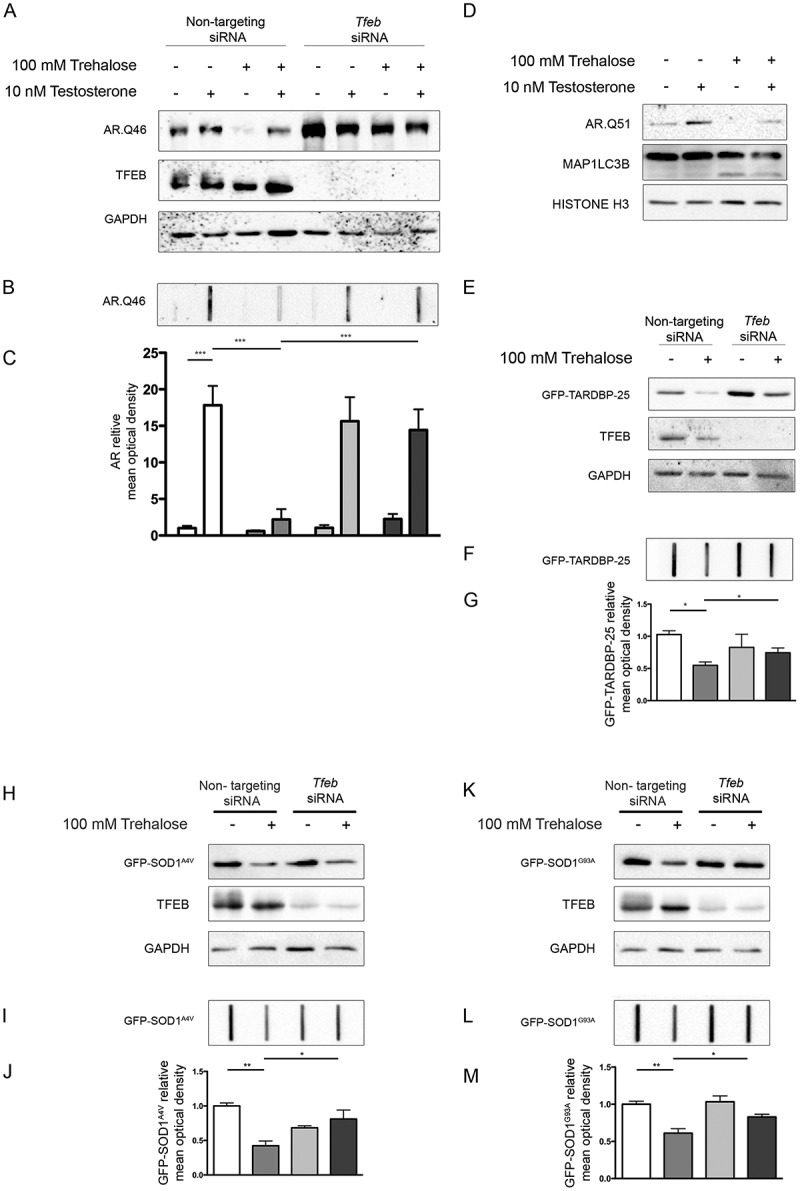
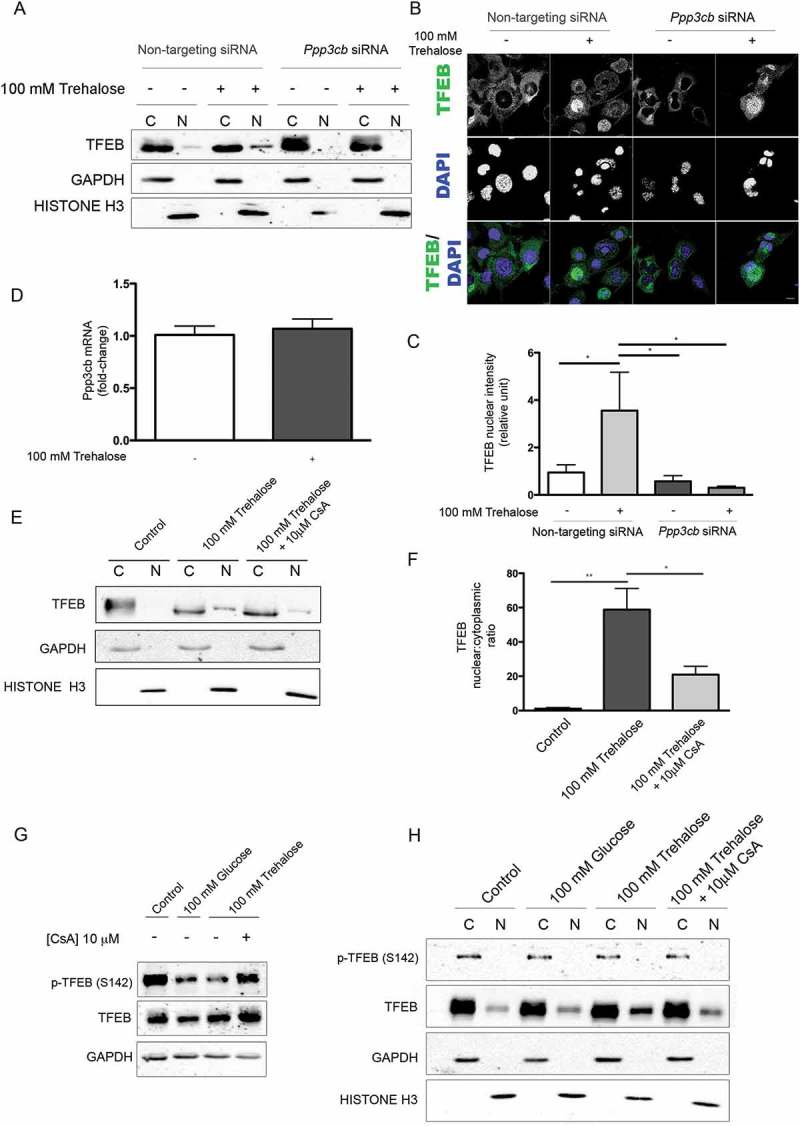
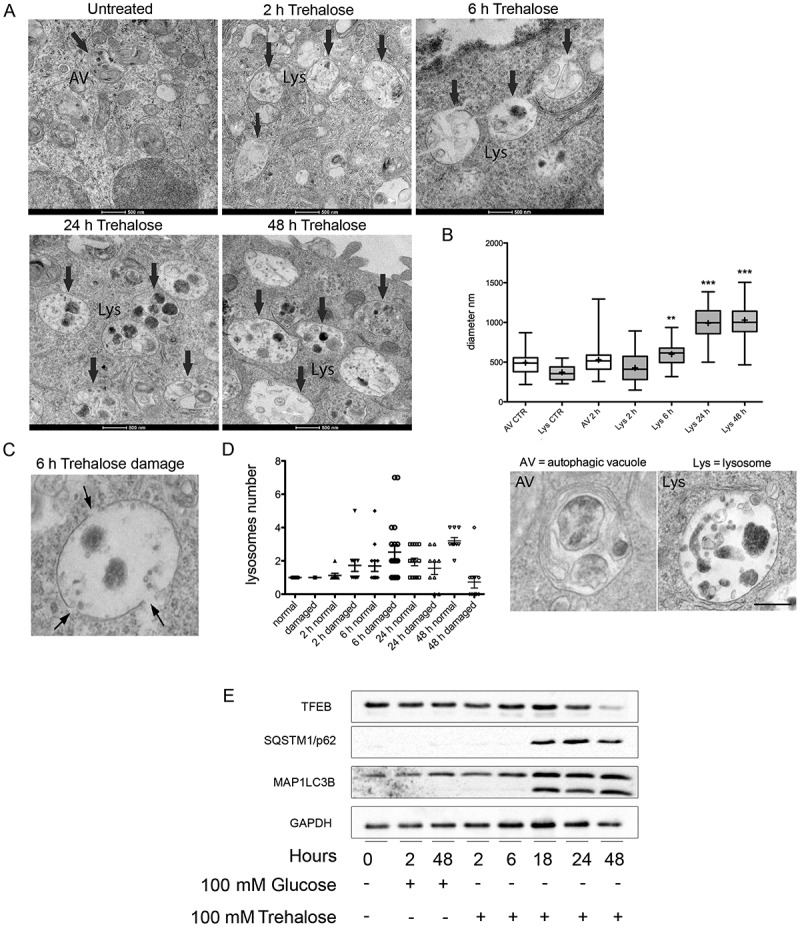
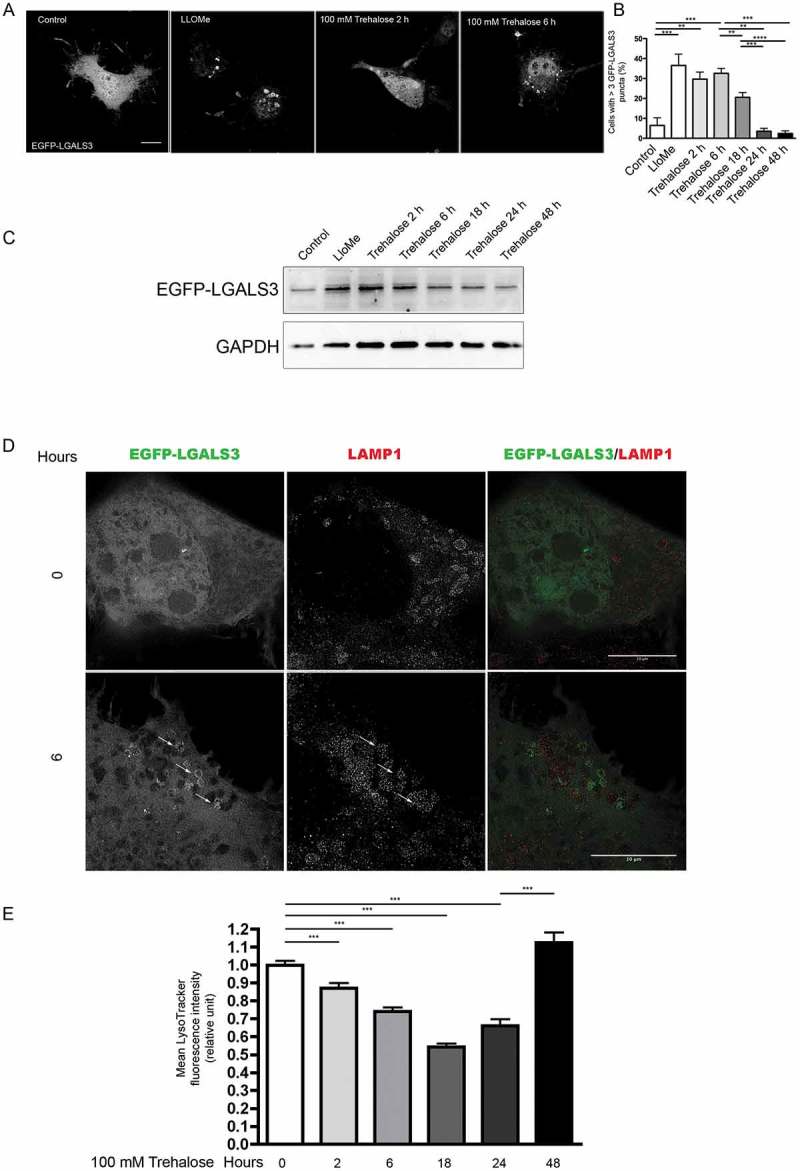
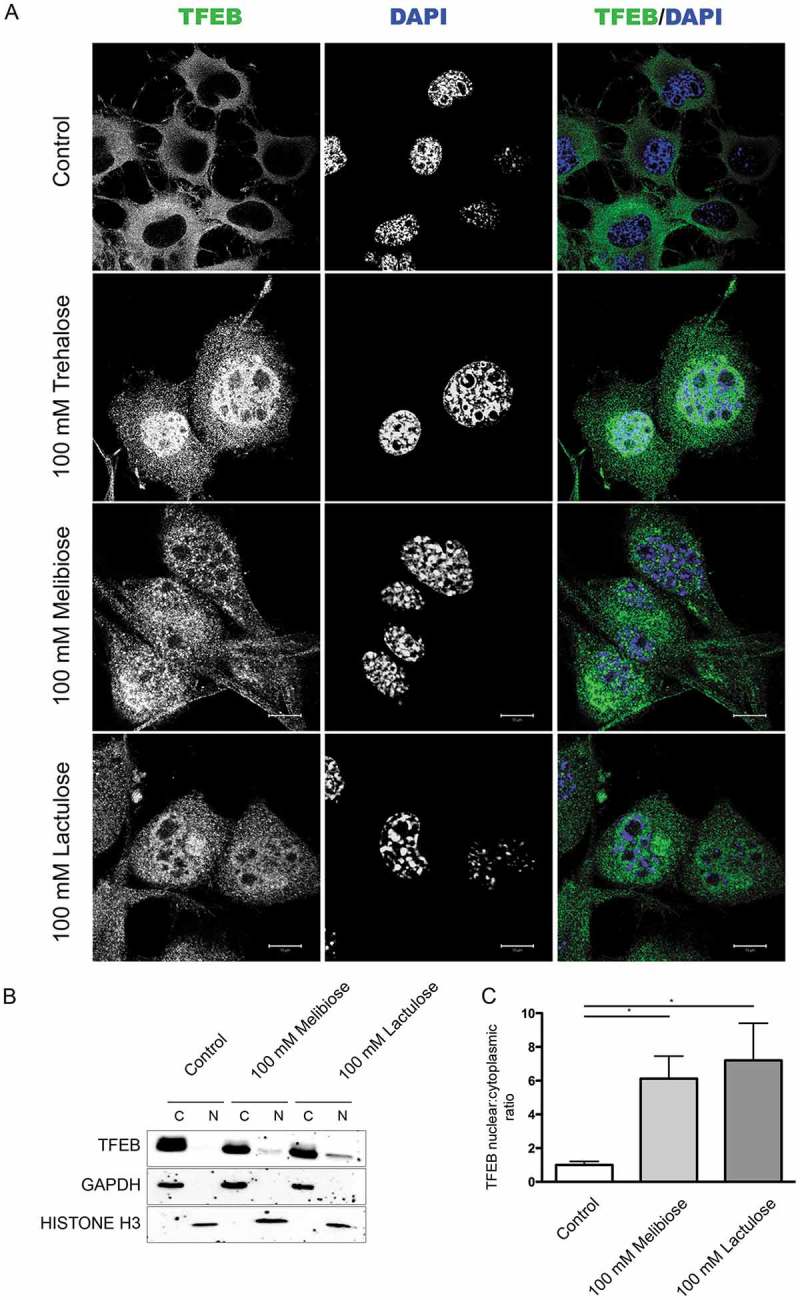
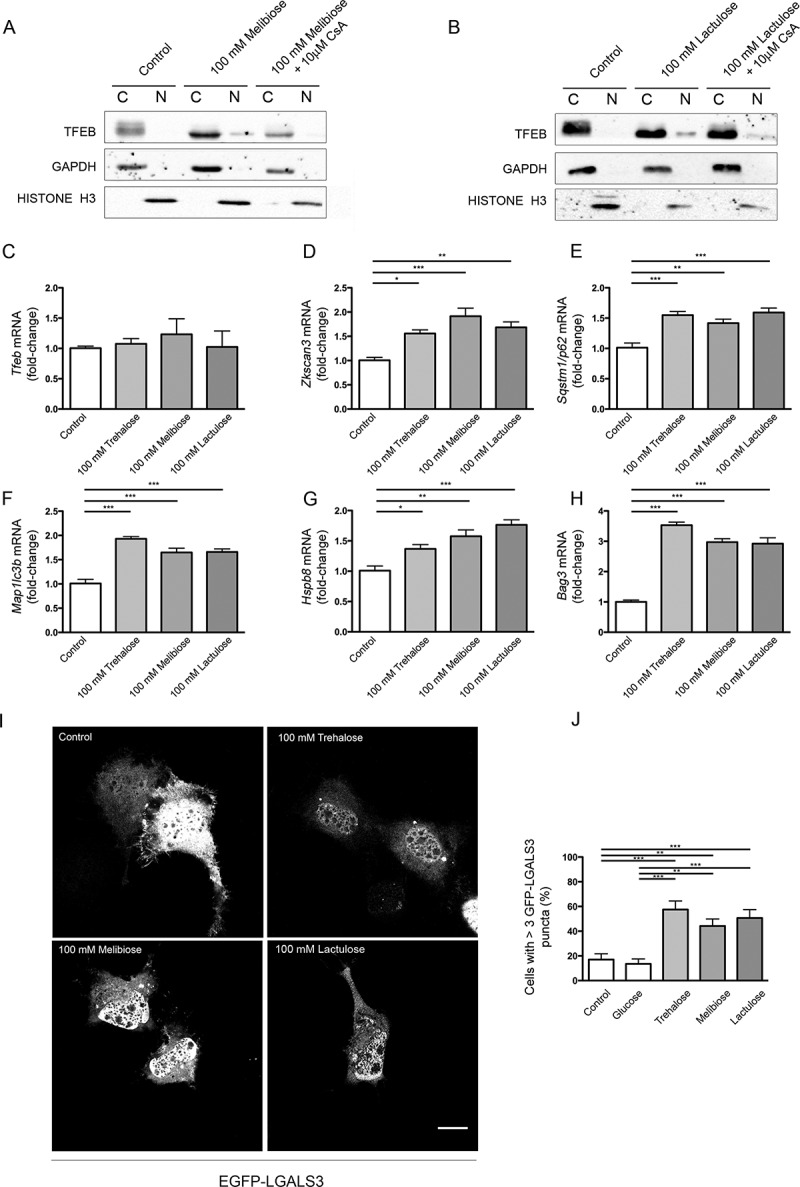
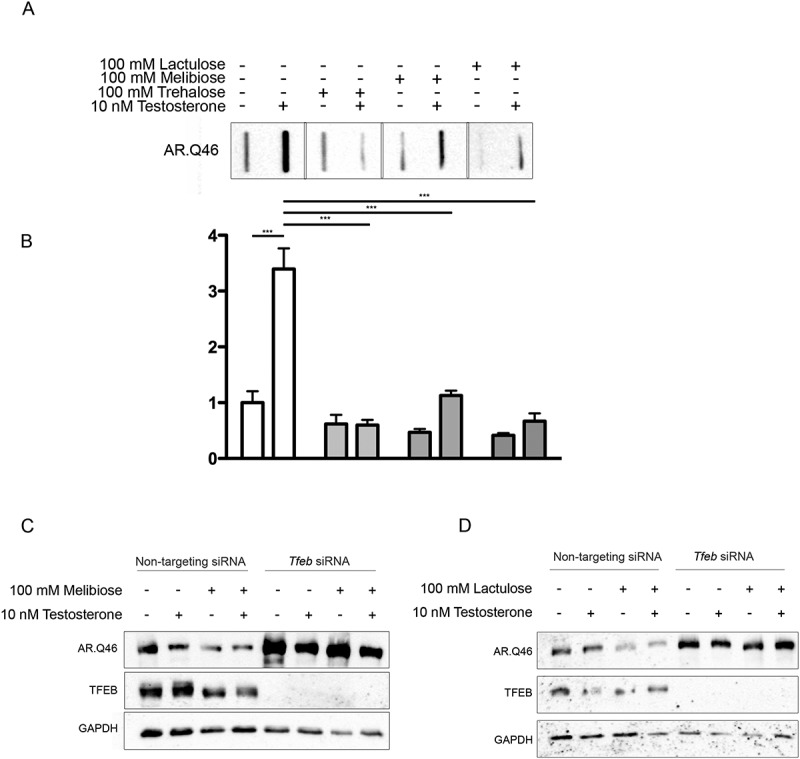
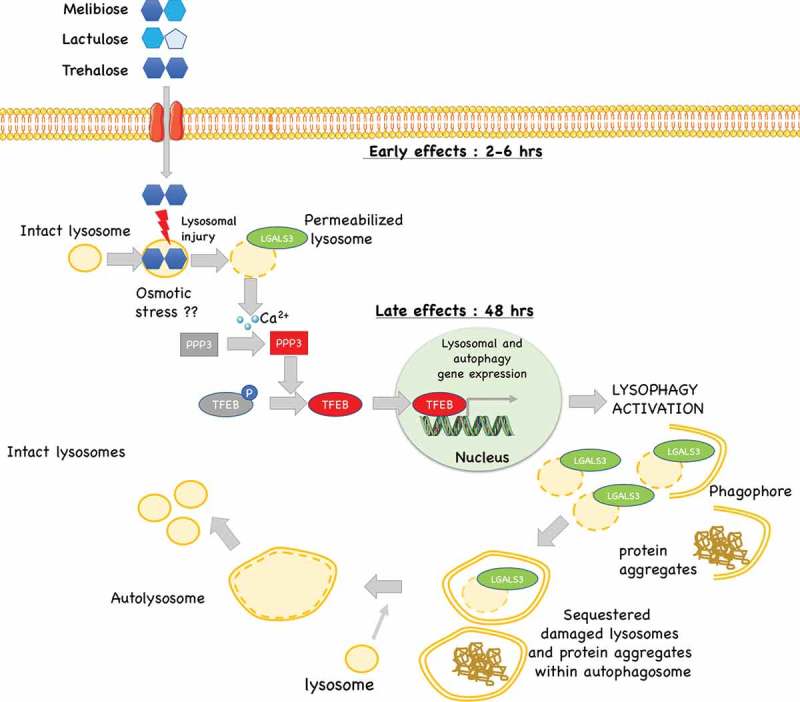
Macroautophagy/autophagy, a defense mechanism against aberrant stresses, in neurons counteracts aggregate-prone misfolded protein toxicity. Autophagy induction might be beneficial in neurodegenerative diseases (NDs). The natural compound trehalose promotes autophagy via TFEB (transcription factor EB), ameliorating disease phenotype in multiple ND models, but its mechanism is still obscure. We demonstrated that trehalose regulates autophagy by inducing rapid and transient lysosomal enlargement and membrane permeabilization (LMP). This effect correlated with the calcium-dependent phosphatase PPP3/calcineurin activation, TFEB dephosphorylation and nuclear translocation. Trehalose upregulated genes for the TFEB target and regulator Ppargc1a, lysosomal hydrolases and membrane proteins (Ctsb, Gla, Lamp2a, Mcoln1, Tpp1) and several autophagy-related components (Becn1, Atg10, Atg12, Sqstm1/p62, Map1lc3b, Hspb8 and Bag3) mostly in a PPP3- and TFEB-dependent manner. TFEB silencing counteracted the trehalose pro-degradative activity on misfolded protein causative of motoneuron diseases. Similar effects were exerted by trehalase-resistant trehalose analogs, melibiose and lactulose. Thus, limited lysosomal damage might induce autophagy, perhaps as a compensatory mechanism, a process that is beneficial to counteract neurodegeneration. Abbreviations: ALS: amyotrophic lateral sclerosis; AR: androgen receptor; ATG: autophagy related; AV: autophagic vacuole; BAG3: BCL2-associated athanogene 3; BECN1: beclin 1, autophagy related; CASA: chaperone-assisted selective autophagy; CTSB: cathepsin b; DAPI: 4',6-diamidino-2-phenylindole; DMEM: Dulbecco's modified Eagle's medium; EGFP: enhanced green fluorescent protein; fALS, familial amyotrophic lateral sclerosis; FRA: filter retardation assay; GAPDH: glyceraldehyde-3-phosphate dehydrogenase; GLA: galactosidase, alpha; HD: Huntington disease; hIPSCs: human induced pluripotent stem cells; HSPA8: heat shock protein A8; HSPB8: heat shock protein B8; IF: immunofluorescence analysis; LAMP1: lysosomal-associated membrane protein 1; LAMP2A: lysosomal-associated membrane protein 2A; LGALS3: lectin, galactose binding, soluble 3; LLOMe: L-leucyl-L-leucine methyl ester; LMP: lysosomal membrane permeabilization; Lys: lysosomes; MAP1LC3B: microtubule-associated protein 1 light chain 3 beta; MCOLN1: mucolipin 1; mRNA: messenger RNA; MTOR: mechanistic target of rapamycin kinase; NDs: neurodegenerative diseases; NSC34: neuroblastoma x spinal cord 34; PBS: phosphate-buffered saline; PD: Parkinson disease; polyQ: polyglutamine; PPARGC1A: peroxisome proliferative activated receptor, gamma, coactivator 1 alpha; PPP3CB: protein phosphatase 3, catalytic subunit, beta isoform; RT-qPCR: real-time quantitative polymerase chain reaction; SBMA: spinal and bulbar muscular atrophy; SCAs: spinocerebellar ataxias; siRNA: small interfering RNA; SLC2A8: solute carrier family 2, (facilitated glucose transporter), member 8; smNPCs: small molecules neural progenitors cells; SOD1: superoxide dismutase 1; SQSTM1/p62: sequestosome 1; STED: stimulated emission depletion; STUB1: STIP1 homology and U-box containing protein 1; TARDBP/TDP-43: TAR DNA binding protein; TFEB: transcription factor EB; TPP1: tripeptidyl peptidase I; TREH: trehalase (brush-border membrane glycoprotein); WB: western blotting; ZKSCAN3: zinc finger with KRAB and SCAN domains 3.

Keywords: Amyotrophic lateral sclerosis; TFEB; autophagy; calcineurin; galectin-3; lactulose; lysosomes; melibiose; motoneuron diseases; neurodegeneration; protein quality control; spinal and bulbar muscular atrophy; trehalose.


Figures

Figure 1.
Figure 1.
Trehalose activates TFEB nuclear translocation and induces protein quality control genes. (a-m) NSC34 cells were treated with 100 mM trehalose or glucose (as control) for different times. (a) IF analysis performed with anti-TFEB antibody (green), nuclei were stained with DAPI (blue) (63X magnification). Scale bar: 10 μm. (b) The bar graph represents the quantification of TFEB nuclear intensity; the fields were randomly selected and at least 100 cells for each sample were analyzed (n = 3) (*p < 0.05, ** p < 0.005, *** p < 0.001, one-way ANOVA with Tukey’s test). (c) WB analysis of cytoplasmic (C) and nuclear extracts (N). GAPDH and histone H3 were used as loading controls for cytoplasmic and nuclear fractions, respectively. (d-m) RT-qPCR analyses. The relative fold difference in mRNA expression was determined using t = 0 as internal control. Data are means ± SD of 4 independent samples. RT-qPCR on the following mRNA: Tfeb (d); Zkscan3 (e); Sqstm1/p62 (f); Map1lc3b (g); Atg10 (h); Atg12 (i); Hspb8 (j); Bag3 (k); Becn1 (l); Ppargc1A (m). Bar graphs represent the relative fold induction of these genes (*p < 0.05, ** p < 0.005, *** p < 0.001, one-way ANOVA with Tukey’s test).
Figure 2.
Figure 2.
TFEB silencing counteracts trehalose-induced expression of autophagic genes. (a-n) NSC34 cells were transfected with Tfeb or non-targeting (as control) siRNAs and treated with 100 mM glucose or trehalose. (a) WB analysis was performed, and the bar graphs (b-c) represent the mean relative optical density of SQSTM1/p62 and MAP1LC3B-II:MAP1LC3B-I protein expression levels, respectively, performed with = 3 independent samples. LC3-II:LC3-I ratio was calculated by densitometric analysis of both bands. (*** p < 0.001, two-way ANOVA with Tukey’s test.) (d-n) RT-qPCR for the following mRNA: Tfeb (d); Zkscan3 (e); Ppargc1a (f); Sqstm1/p62 (g); Lc3 (h); HspB8 (i); Ctsb (j); Gla (k); Lamp2A (l); Mcoln1 (m); Tpp1 (n); the bar graphs represent the relative fold induction of these genes normalized with Rplp0 mRNA levels. Data are means ± SD of 4 independent samples (** p < 0.005, *** p < 0.001, two-way ANOVA with Bonferroni’s test).
Figure 3.
Figure 3.
TFEB silencing counteracts trehalose-induced pro-degradative effects. (a-c) NSC34 cells were transfected with Tfeb siRNA or non-targeting siRNAs, and with AR.Q46, untreated or treated with 100 mM trehalose, in absence or in presence of 10 nM testosterone for 48 h. (a) WB analysis and (b) FRA were performed. (c) The bar graph represents the mean relative optical density of FRA ± SD for = 3 independent samples (*** p < 0.001, two-way ANOVA with Bonferroni’s test). (d) WB analysis on iPSCs derived from SBMA patient (Q51) and differentiated to motoneuronal-like cells for 10 days in absence or in presence of 10 nM testosterone, and treated with 100 mM trehalose for the last 48 h. WB blot analysis was performed. Histone H3 was used for loading control. (e-g) NSC34 cells were transfected with Tfeb siRNA or non-targeting siRNA, and with GFP-TARDBP-25 for 48 h, untreated or treated with 100 mM trehalose for 48 h (e) WB analysis and (f) FRA were performed. (g)The bar graph represents the mean relative optical density of FRA ± SD for = 3 independent samples (*p < 0.05, two-way ANOVA with Bonferroni’s test). (h-m) NSC34 cells were transfected with Tfeb siRNA or non-targeting siRNA, and with mutant GFP-SOD1 (SOD1A4V and G93A), for 48 h, untreated or treated with 100 mM trehalose for 48 h. WB analysis (h, k) and FRA were performed (i,l). (j,m) The bar graphs represent the mean relative optical density of FRA ± SD for = 3 independent samples (*p < 0.05, two-way ANOVA with Bonferroni’s test). For WB experiments, GAPDH was used as an internal loading control.
Figure 4.
Figure 4.
Trehalose-induced TFEB activation is mediated by PPP3CB activity. (a-c) NSC34 were transfected with Ppp3cB or non-targeting siRNA, and treated with 100 mM trehalose or untreated (as control) for 48 h. (A) WB analysis of cytoplasmic (C) and nuclear extracts (N). (b) IF analysis performed with anti-TFEB antibody (green), nuclei were stained with DAPI (blue) (63X magnification). Scale bar: 10 μm. (c) The bar graph represents the quantification of TFEB nuclear intensity; the fields were randomly selected and at least 100 cells for each sample were analyzed (n = 3) (*p < 0.05, ** p < 0.005, *** p < 0.001, one-way ANOVA with Tukey’s test). (d) RT-qPCR for Ppp3cB mRNA performed on NSC34 cells treated with 100 mM trehalose or untreated (as control) for 48 h. The relative fold difference of mRNA expression was determined using untreated samples as internal control. Data are means ± SD of 4 independent samples. (e) WB analysis of cytoplasmic (C) and nuclear extracts (N) on NSC34 cells treated (or untreated) with 100 mM trehalose, in the absence or in presence of 10 μM CsA) for 1 h. (f) The bar graph represents mean ± SD for = 4 independent samples of nuclear:cytoplasmic TFEB ratio compared to control (*p < 0.05, ** p < 0.005, one-way ANOVA with Tukey’s test). (g-h) For the determination of TFEB phosphorylation levels at Ser142, NSC34 were transfected with TFEB and treated with 100 mM glucose or 100 mM trehalose in the absence or in presence of 10 μM CsA for 1 h. (g) WB analysis and (h) WB analysis of cytoplasmic (C) and nuclear extracts (N) were performed. For WB fractionation experiments, GAPDH and histone H3 were used as an internal loading control for cytoplasmic and nuclear fraction, respectively.
Figure 5.
Figure 5.
Electron microscopy analysis of trehalose effects on lysosome morphology. (a) NSC34 cells were treated with 100 mM trehalose for the indicated times and processed for electron microscopy. Lys, lysosome. Scale bar: 500 nm. (b) Quantification of the diameter of autophagic vesicles (AV) and lysosomes (Lys) in control (CTR) and trehalose-treated cells at different times. Examples of the morphology of the quantified organelles are shown below the graph. Scale bar: 200 nm. (c) High-scale magnification of an enlarged and damaged lysosome. Arrows point to gaps in the limiting membrane. Please note that the electron-dense material in the lysosomal lumen is sparse, a feature that is never observed in untreated cells. (d) Quantification of the number of lysosomes presenting gaps on their limiting membrane in control cells and cells treated as indicated (*p < 0.05, *** p < 0.001 non-parametric one-way ANOVA with Kruskal-Wallis test). (e) WB analysis was performed on NSC34 cells treated with 100 mM trehalose or glucose (as control) for different time periods.
Figure 6.
Figure 6.
Trehalose induces lysosome membrane permeability. NSC34 cells were transfected with a plasmid encoding EGFP-LGALS3, and treated with 100 mM trehalose for different time periods or with 0.3 mM LLOMe for 1 h as a positive control. (a) Fluorescence microscopy analysis on cells treated with trehalose for 2 or 6 h, or with LLOMe (63X magnification). Scale bar: 10 μm. (b) The bar graph shows the quantification of percentage of cells with > 3 EGFP-LGALS3 puncta after trehalose treatment at different time points; the fields were randomly selected and at least 100 cells for each sample were counted (n = 3). (** p < 0.005, *** p < 0.001, one-way ANOVA with Tukey’s test.) (c) WB analysis of EGFP-LGALS3 protein levels, GAPDH was used as a loading control (d) Cells treated as in A and labeled with anti-LAMP1 (red) to visualize lysosomes were analyzed by STED microscopy. Arrows point to examples of EGFP-LGALS3 (green)-positive lysosomes. Scale bar: 10 μm (e) Cytofluorimetric analysis performed on NSC34 cells treated with trehalose for different time periods, and labelled with LysoTracker Green. Mean fluorescence intensity was measured (n = 4) (*** p < 0.001, one-way ANOVA with Tukey’s test).
Figure 7.
Figure 7.
Melibiose and lactulose induce TFEB nuclear translocation. (a) IF analysis of TFEB localization performed on NSC34 cells treated with 100 mM trehalose, 100 mM melibiose or 100 mM lactulose for 48 h. Nuclei were stained with DAPI (blue) (63X magnification). Scale bar: 10 μm. (b) WB analysis of cytoplasmic (C) and nuclear extracts (N) on NSC34 cells untreated (control) or treated with 100 mM melibiose or 100 mM lactulose for 48 h. GAPDH and histone H3 were used as internal loading control for cytoplasmic and nuclear fractions, respectively. (c) The bar graph represents the mean ± SD for = 4 independent samples of nuclear:cytoplasmic TFEB ratio compared to untreated cells (*p < 0.05 one-way ANOVA with Tukey’s test).
Figure 8.
Figure 8.
Melibiose and lactulose effects are mediated by PPP3CB: induction of ALP gene expression and LMP. (a-b) WB analysis of cytoplasmic (c) and nuclear extracts (N) of NSC34 cells untreated (control) or treated with 100 mM melibiose (a) or 100 mM lactulose (b) in the absence or presence of 10 μM CsA for 1 h. GAPDH and histone H3 were used as internal loading controls for cytoplasmic and nuclear fractions, respectively. (c-h) RT-qPCR on NSC34 cells untreated (control) or treated with 100 mM trehalose, 100 mM melibiose or 100 mM lactulose for 48 h. The relative fold difference of mRNA expression was determined using untreated samples as internal control. Data are means ± SD of 4 independent samples. RT-qPCR for the following mRNA: Tfeb (c); Zkscan3 (d); Sqstm1/p62 (e); Map1Lc3b (f); Hspb8 (g); Bag3 (h). Bar graphs represent the relative fold induction of these genes (*p < 0.05, ** p < 0.005, *** p < 0.001, one-way ANOVA with Tukey’s test). (i) Fluorescence microscopy analysis (63X magnification) performed on NSC34 cells that were transfected with a plasmid encoding EGFP-LGALS3, and treated with 100 mM trehalose, 100 mM melibiose or 100 mM lactulose for 2 h; scale bar: 10 μm. (j) Bar graph shows the quantification of percentage of cells with > 3 EGFP-LGALS3 puncta; the fields were randomly selected and at least 100 cells for each sample were counted (n = 3) (** p < 0.005, *** p < 0.001, one-way ANOVA with Tukey’s test).
Figure 9.
Figure 9.
TFEB mediated pro-degradative effects of melibiose and lactulose on ARpolyQ clearance. (a) FRA analysis performe on NSC34 cells transfected with AR.Q46, untreated or treated with 100 mM trehalose, melibiose or lactulose in the absence or in presence of 10 nM testosterone for 48 h. (b) The bar graph represents the mean relative optical density of FRA ± SD for = 3 independent samples (*** p < 0.001, two-way ANOVA with Bonferroni’s test). (c-d) WB analysis performed on NSC34 cells transfected with Tfeb siRNA or non-targeting siRNA, and with AR.Q46, in absence or in presence of 10 nM testosterone for 48 h treated with 100 mM melibiose or lactulose, respectively.
Figure 10.
Figure 10.
Proposed model of the mechanism of action trehalose, and its analogs: trehalose, melibiose and lactulose act on lysosomes inducing a transient lysosomal membrane permeability. This causes Ca2+ leaks which activates the phosphatase PPP3/calcineurin. PPP3 specifically de-phosphorylates TFEB inducing its activation and nuclear translocation to activate autophagy and lysophagy with removal of damaged lysosomes and in parallel (if present) misfolded protein aggregates.

References

    1. Klionsky DJ, Abdelmohsen K, Abe A, et al. Guidelines for the use and interpretation of assays for monitoring autophagy (3rd edition). Autophagy. 2016;12:1–222. - PMC - PubMed
    1. Galluzzi L, Bravo-San Pedro JM, Levine B, et al. Pharmacological modulation of autophagy: therapeutic potential and persisting obstacles. Nat Rev Drug Discov. 2017;16:487–511. - PMC - PubMed
    1. Jackson MP, Hewitt EW.. Cellular proteostasis: degradation of misfolded proteins by lysosomes. Essays Biochem. 2016;60:173–180. - PMC - PubMed
    1. Haidar M, Timmerman V.. Autophagy as an emerging common pathomechanism in inherited peripheral neuropathies. Front Mol Neurosci. 2017;10:143. - PMC - PubMed
    1. Lumkwana D, Du Toit A, Kinnear C, et al. Autophagic flux control in neurodegeneration: progress and precision targeting-Where do we stand? Progr Neurobiol. 2017;153:64–85. - PubMed

Publication types

MeSH terms