

Intracochlear Electrocochleography: Response Patterns During Cochlear Implantation and Hearing Preservation
- PMID: 30335669
- PMCID: PMC6534483
- DOI: 10.1097/AUD.0000000000000659
Intracochlear Electrocochleography: Response Patterns During Cochlear Implantation and Hearing Preservation
Abstract
Objectives: Electrocochleography (ECochG) obtained through a cochlear implant (CI) is increasingly being tested as an intraoperative monitor during implantation with the goal of reducing surgical trauma. Reducing trauma should aid in preserving residual hearing and improve speech perception overall. The purpose of this study was to characterize intracochlear ECochG responses throughout insertion in a range of array types and, when applicable, relate these measures to hearing preservation. The ECochG signal in cochlear implant subjects is complex, consisting of hair cell and neural generators with differing distributions depending on the etiology and history of hearing loss. Consequently, a focus was to observe and characterize response changes as an electrode advances.
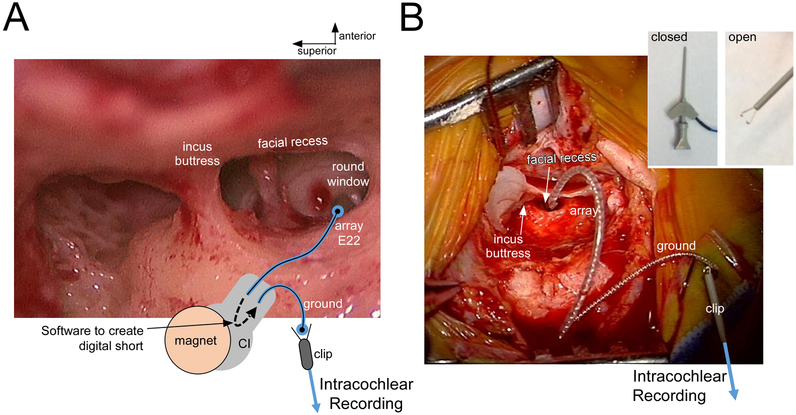
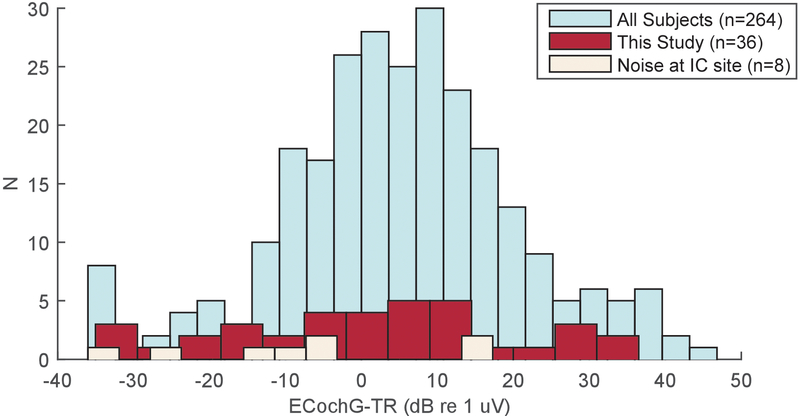
Design: In 36 human subjects, responses to 90 dB nHL tone bursts were recorded both at the round window (RW) and then through the apical contact of the CI as the array advanced into the cochlea. The specific setup used a sterile clip in the surgical field, attached to the ground of the implant with a software-controlled short to the apical contact. The end of the clip was then connected to standard audiometric recording equipment. The stimuli were 500 Hz tone bursts at 90 dB nHL. Audiometry for cases with intended hearing preservation (12/36 subjects) was correlated with intraoperative recordings.
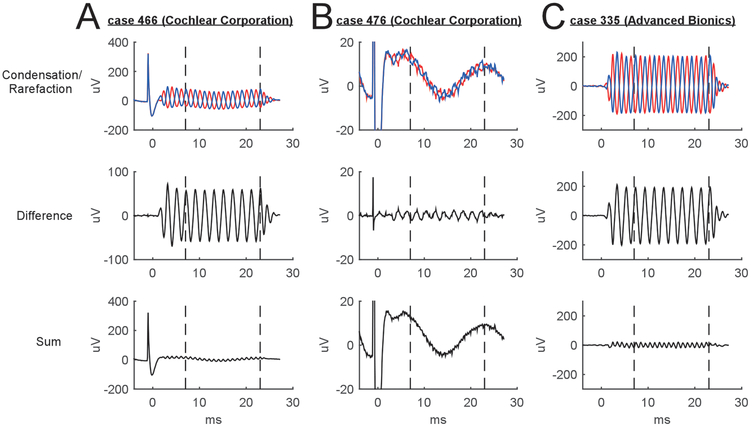
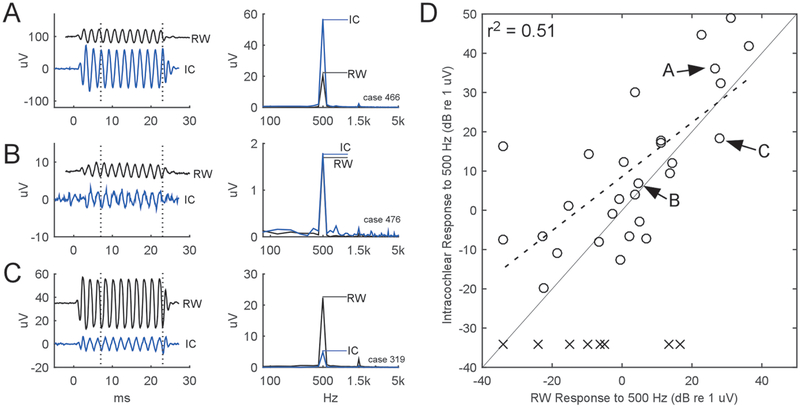
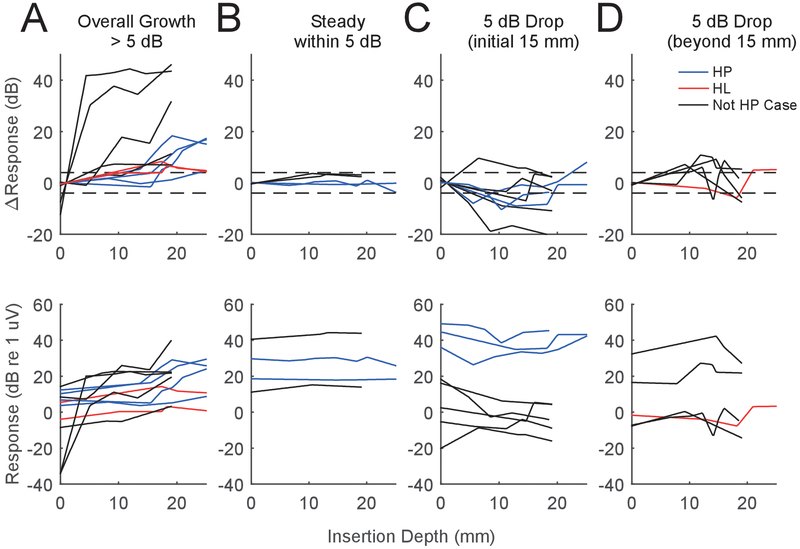
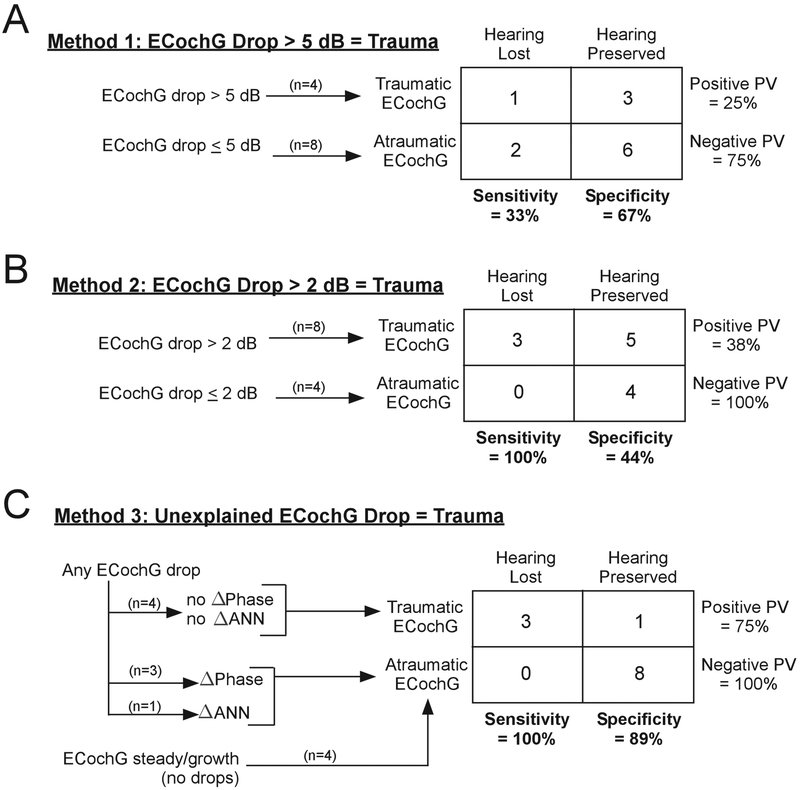
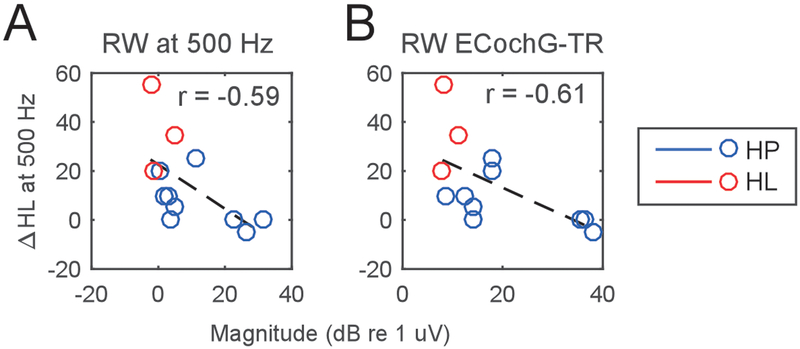
Results: Successful intracochlear recordings were obtained in 28 subjects. For the eight unsuccessful cases, the clip introduced excessive line noise, which saturated the amplifier. Among the successful subjects, the initial intracochlear response was a median 5.8 dB larger than the response at the RW. Throughout insertion, modiolar arrays showed median response drops after stylet removal while in lateral wall arrays the maximal median response magnitude was typically at the deepest insertion depth. Four main patterns of response magnitude were seen: increases > 5 dB (12/28), steady responses within 5 dB (4/28), drops > 5 dB (from the initial response) at shallow insertion depths (< 15 mm deep, 7/28), or drops > 5 dB occurring at deeper depths (5/28). Hearing preservation, defined as < 80 dB threshold at 250 Hz, was successful in 9/12 subjects. In these subjects, an intracochlear loss of response magnitude afforded a prediction model with poor sensitivity and specificity, which improved when phase, latency, and proportion of neural components was considered. The change in hearing thresholds across cases was significantly correlated with various measures of the absolute magnitudes of response, including RW response, starting response, maximal response, and final responses (p's < 0.05, minimum of 0.0001 for the maximal response, r's > 0.57, maximum of 0.80 for the maximal response).
Conclusions: Monitoring the cochlea with intracochlear ECochG during cochlear implantation is feasible, and patterns of response vary by device type. Changes in magnitude alone did not account for hearing preservation rates, but considerations of phase, latency, and neural contribution can help to interpret the changes seen and improve sensitivity and specificity. The correlation between the absolute magnitude obtained either before or during insertion of the ECochG and the hearing threshold changes suggest that cochlear health, which varies by subject, plays an important role.
Figures


Similar articles
-
Intraoperative Intracochlear Electrocochleography and Residual Hearing Preservation Outcomes When Using Two Types of Slim Electrode Arrays in Cochlear Implantation.Otol Neurotol. 2019 Jun;40(5S Suppl 1):S29-S37. doi: 10.1097/MAO.0000000000002212. Otol Neurotol. 2019. PMID: 31225820 Clinical Trial.
-
Monitoring Cochlear Health With Intracochlear Electrocochleography During Cochlear Implantation: Findings From an International Clinical Investigation.Ear Hear. 2023 Mar-Apr 01;44(2):358-370. doi: 10.1097/AUD.0000000000001288. Epub 2022 Nov 8. Ear Hear. 2023. PMID: 36395515 Free PMC article.
-
Monitoring of the Inner Ear Function During and After Cochlear Implant Insertion Using Electrocochleography.Trends Hear. 2019 Jan-Dec;23:2331216519833567. doi: 10.1177/2331216519833567. Trends Hear. 2019. PMID: 30909815 Free PMC article.
-
[Application of extra- and intracochlear electrocochleography during and after cochlear implantation].HNO. 2025 Jan;73(1):14-21. doi: 10.1007/s00106-024-01481-4. Epub 2024 May 18. HNO. 2025. PMID: 38761228 Free PMC article. Review. German.
-
Outcomes review of modern hearing preservation technique in cochlear implant.Auris Nasus Larynx. 2016 Oct;43(5):485-8. doi: 10.1016/j.anl.2016.02.014. Epub 2016 Mar 11. Auris Nasus Larynx. 2016. PMID: 26976547 Review.
Cited by
-
Clinical experiences with intraoperative electrocochleography in cochlear implant recipients and its potential to reduce insertion trauma and improve postoperative hearing preservation.PLoS One. 2022 Apr 22;17(4):e0266077. doi: 10.1371/journal.pone.0266077. eCollection 2022. PLoS One. 2022. PMID: 35452461 Free PMC article.
-
Characterizing Insertion Pressure Profiles During Cochlear Implantation: Simultaneous Fluoroscopy and Intracochlear Pressure Measurements.Otol Neurotol. 2020 Jan;41(1):e46-e54. doi: 10.1097/MAO.0000000000002437. Otol Neurotol. 2020. PMID: 31613835 Free PMC article.
-
Identifying Slim Modiolar Electrode Tip Fold-Over With Intracochlear Electrocochleography.Otolaryngol Head Neck Surg. 2024 Apr;170(4):1124-1132. doi: 10.1002/ohn.587. Epub 2023 Nov 29. Otolaryngol Head Neck Surg. 2024. PMID: 38018567 Free PMC article.
-
Optical method to preserve residual hearing in patients receiving a cochlear implant.Front Audiol Otol. 2024;2:1376699. doi: 10.3389/fauot.2024.1376699. Epub 2024 Apr 15. Front Audiol Otol. 2024. PMID: 40791787 Free PMC article.
-
Evaluation of Real-Time Intracochlear Electrocochleography for Guiding Cochlear Implant Electrode Array Position.J Clin Med. 2023 Nov 29;12(23):7409. doi: 10.3390/jcm12237409. J Clin Med. 2023. PMID: 38068461 Free PMC article.
References
-
- Acharya AN, Tavora-Vieira D and Rajan GP (2016). “Using the Implant Electrode Array to Conduct Real-time Intraoperative Hearing Monitoring During Pediatric Cochlear Implantation: Preliminary Experiences.” Otology & Neurotology 37(2): e148–e153. - PubMed
-
- Adel Y, Rader Y, Bahmer A and Baumann U (2015). Recording Low-Frequency Acoustically Evoked Potentials using Cochlear Implants. 2015 Conference on Implantable Auditory Prostheses.
-
- Adunka OF, Pillsbury H and Buchman C (2009). “Minimizing intracochlear trauma during cochlear implantation.” - PubMed
Publication types
MeSH terms
Grants and funding
LinkOut - more resources
Full Text Sources
Miscellaneous
