. 2019 Feb;160(2):463-485.
doi: 10.1097/j.pain.0000000000001416.

Comprehensive analysis of long noncoding RNA expression in dorsal root ganglion reveals cell-type specificity and dysregulation after nerve injury

Affiliations

Comprehensive analysis of long noncoding RNA expression in dorsal root ganglion reveals cell-type specificity and dysregulation after nerve injury

Georgios Baskozos et al. Pain. 2019 Feb.

Abstract

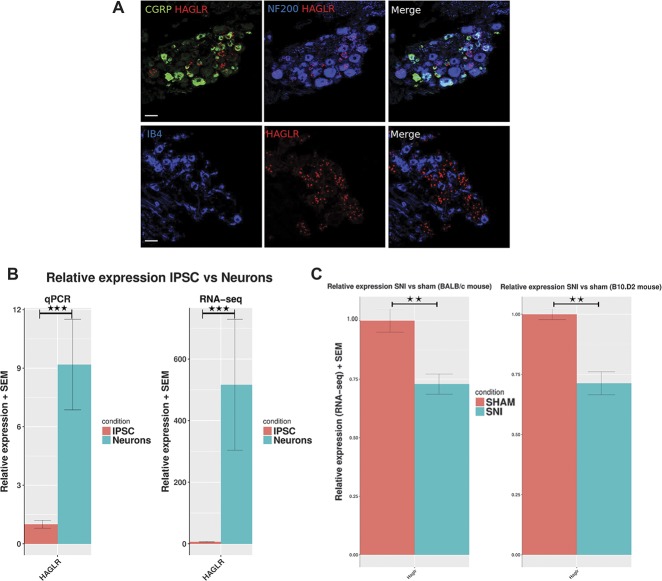
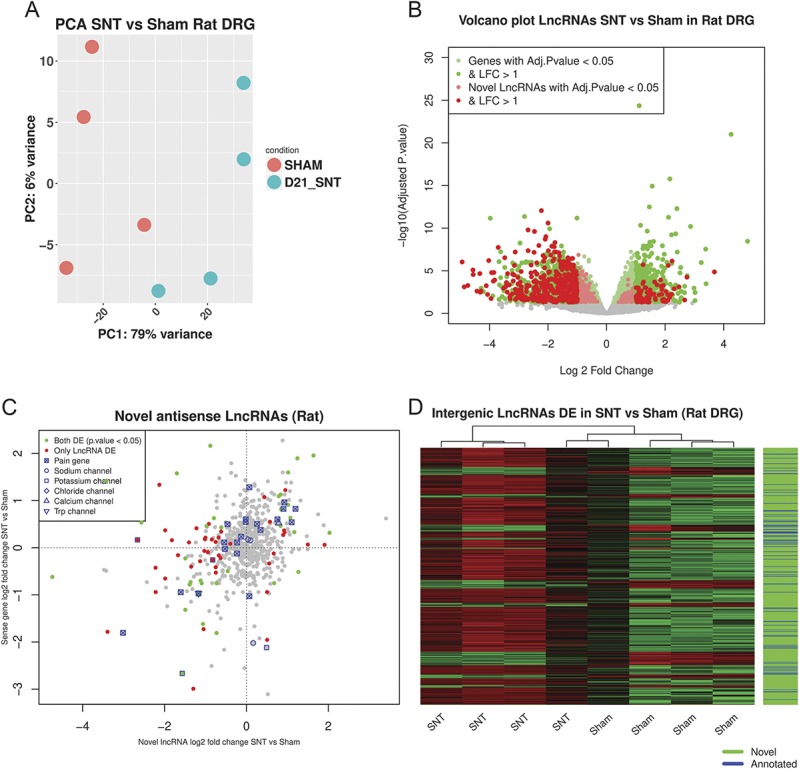
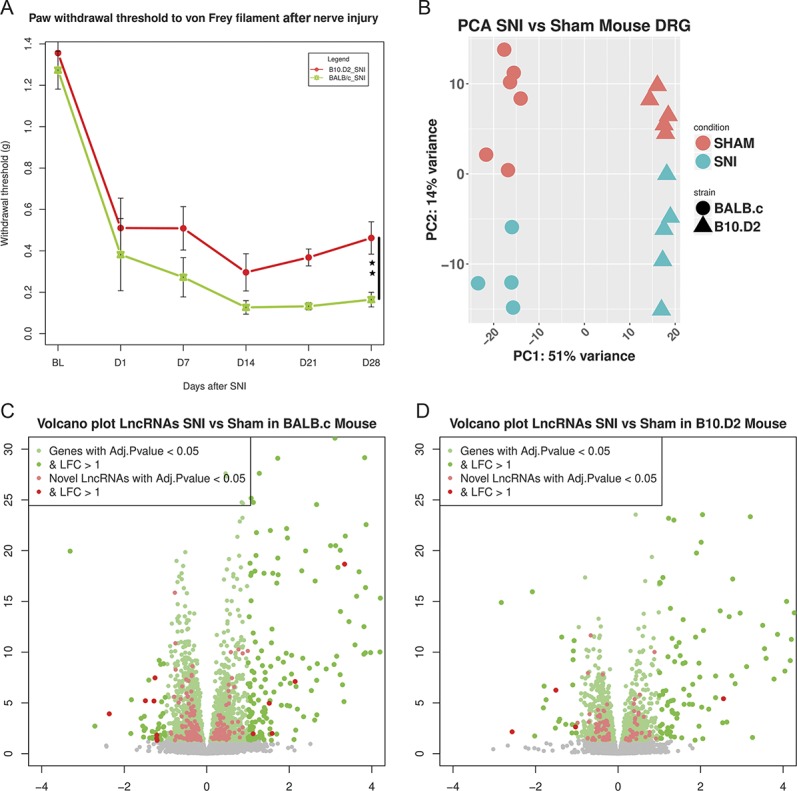
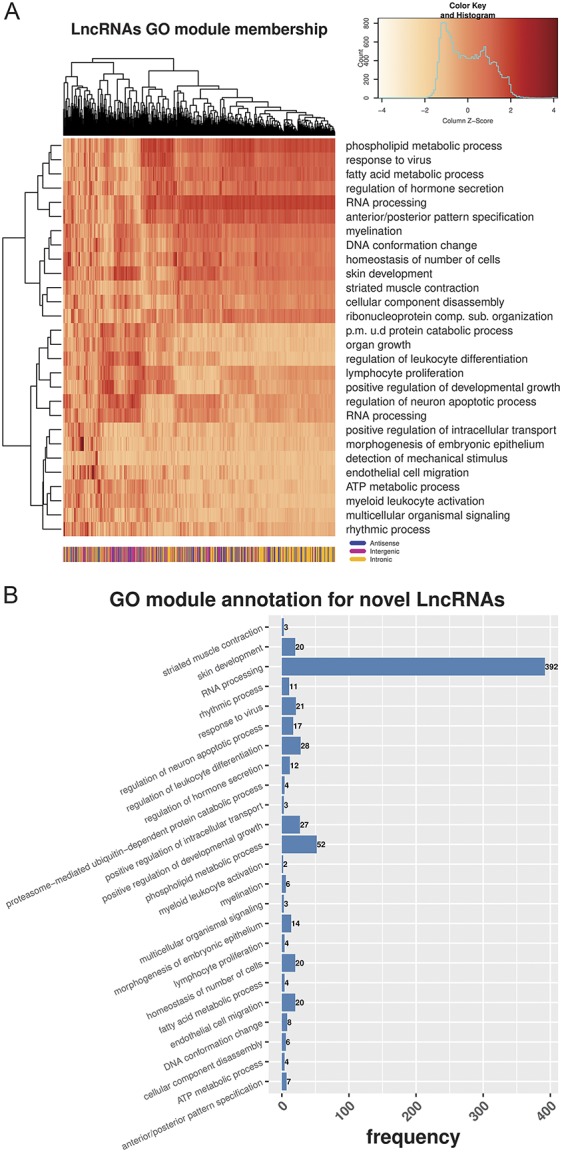
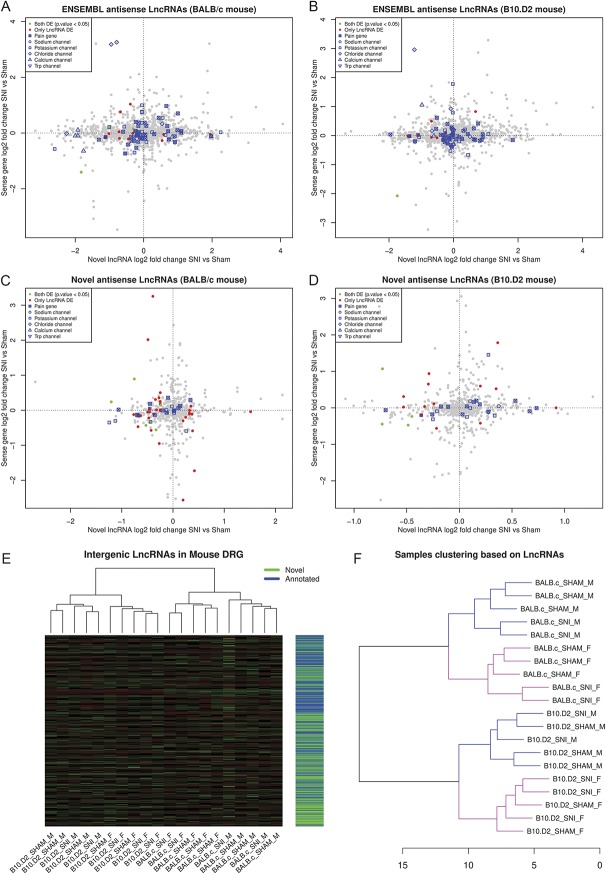
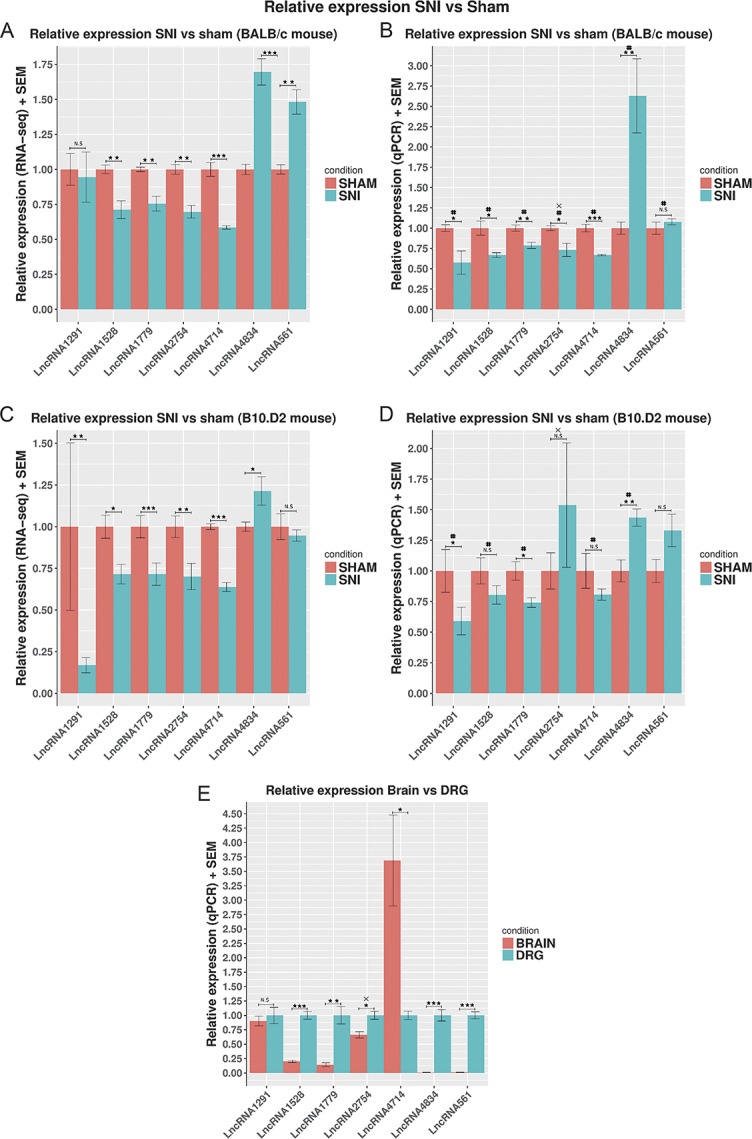
Dorsal root ganglion (DRG) neurons provide connectivity between peripheral tissues and the spinal cord. Transcriptional plasticity within DRG sensory neurons after peripheral nerve injury contributes to nerve repair but also leads to maladaptive plasticity, including the development of neuropathic pain. This study presents tissue and neuron-specific expression profiling of both known and novel long noncoding RNAs (LncRNAs) in the rodent DRG after nerve injury. We have identified a large number of novel LncRNAs expressed within the rodent DRG, a minority of which were syntenically conserved between the mouse, rat, and human, and including, both intergenic and antisense LncRNAs. We have also identified neuron type-specific LncRNAs in the mouse DRG and LncRNAs that are expressed in human IPS cell-derived sensory neurons. We show significant plasticity in LncRNA expression after nerve injury, which in mice is strain and gender dependent. This resource is publicly available and will aid future studies of DRG neuron identity and the transcriptional landscape in both the naive and injured DRG. We present our work regarding novel antisense and intergenic LncRNAs as an online searchable database, accessible from PainNetworks (http://www.painnetworks.org/). We have also integrated all annotated gene expression data in PainNetworks, so they can be examined in the context of their protein interactions.


Conflict of interest statement

Sponsorships or competing interests that may be relevant to content are disclosed at the end of this article.

Figures

Figure 1.
Figure 1.
Overview of the computational pipeline used for the identification of novel LncRNAs using RNA-seq data. See Materials and Methods—Identification of novel LncRNAs and Supplementary Methods, available at http://links.lww.com/PAIN/A676, identification of novel LncRNAs. DE, differentially expressed; LncRNAs, long noncoding RNAs; UTR, untranslated region.
Figure 2.
Figure 2.
Attributes of novel LncRNAs identified in mice and rats. (A and B) Classification of novel LncRNAs according to genomic context in mice (A) and rats (B). (C and D) Exon distribution of novel LncRNAs in mice (C) and rats (D). (E) Kernel density of distances between novel LncRNAs and 5′ CAGE TSS. Distance is measured in genomic bases. Outlying distances >1.5 × IQR of the distribution were removed (all data in supplementary figure 2 available, at http://links.lww.com/PAIN/A676). Median distance of TSS is 0 bp of the predicted LncRNA transcript. DRG, dorsal root ganglion; IQR, interquartile range; LncRNAs, long noncoding RNAs; TSS, transcription start sites.
Figure 3.
Figure 3.
Features of LncRNA's expression. (A) Median read counts of LncRNAs (novel and ENSEMBL annotated) vs protein-coding genes in mice and rats. Data are presented as mean plus SEM. Significance was assessed with the Mann–Whitney U test (MWW). (B) Principal component analysis plot of the expression of novel LncRNAs in different DRG neuron subtypes. Neuron subtypes are as follows: 1. MHN, 2. MHN (MI, IS), 3. C-LTMR, 4. MHN (IS), 5. MHN (IS), 6. MHN, 7. MHN (NS), 8. MR, 9. MHN, and 10. MR. Axis represents PCs and shows percentage of original data's variance explained by the respective PC (PCA plot of ENSEMBL genes in supplementary figure 3A, available at http://links.lww.com/PAIN/A676). (C) Neuron subtype specificity (tau > 0.8, average log 2 counts > 3 for at least one neuron subtype). Enrichment was assessed with the Fisher exact test for count data. Kernel density of the Tau specificity metric in supplementary figure 3B (available at http://links.lww.com/PAIN/A676). (D) Distribution of neuron subtype–specific novel LncRNAs in different neuron subtypes. C-LTMR, c-fiber low-threshold mechanoreceptors; DRG, dorsal root ganglion; IS, itch sensitive; LncRNAs, long noncoding RNAs; MHN, mechanoheat receptors; MI, mechanically insensitive; MN, mechanical nociceptor; MR, mechanoreceptor; MS, mechanically sensitive; PCA, principal component analysis. P < 0.05*, P < 0.01**, and P < 0.001***.
Figure 4.
Figure 4.
Expression patterns of LncRNAs in human IPSC–derived neurons. (A) Classification of novel LncRNAs according to genomic context. (B) Exon distribution of novel LncRNAs. (C) Median read counts of LncRNAs (novel and ENSEMBL annotated) vs protein-coding genes in human IPSC–derived neurons. Data are presented as mean plus SEM. Significance was assessed with the Mann–Whitney U test (MWW). (D) Heatmap of novel and annotated intergenic LncRNAs DE between human IPSC-derived neurons and IPSC. (E and F) Expression plot of novel antisense LncRNAs (E) and annotated ENSEMBL antisense LncRNAs (F) vs the sense protein-coding gene. LncRNAs antisense to DE genes Kcnj6 and Trpm3 were DE with opposite log2 fold changes to the DE sense gene. P < 0.05*, P < 0.01**, and P < 0.001***. DE, differentially expressed; LncRNAs, long noncoding RNAs.
Figure 5.
Figure 5.
(A) In situ hybridisation for HAGLR LncRNA (mouse ortholog of human HAGLR) shows expression in the mouse WT L4 DRG. The ISH signal was developed using a fast red reaction. From right to left: Representative images of mouse DRG sections stained for HAGLR (red), NF200 (blue), CGRP (green), and IB4 (blue). Scale bar 50 µm. (B) Quantification of expression change of HAGLR in human IPSC vs IPSC-derived neurons. Relative expression assessed by qPCR of HAGLR LncRNA. (C) RNA-seq determined relative expression in SNI vs Sham BALB/c and B10.D2 mice DRG. Data are presented as mean plus SEM. P < 0.05*, P < 0.01**, and P < 0.001***. DRG, dorsal root ganglion; ISH, in situ hybridization; LncRNAs, long noncoding RNAs; qPCR, quantitative real-time polymerase chain reaction; SNI, spared nerve injury.
Figure 6.
Figure 6.
Dorsal root ganglion transcriptional response in rats after peripheral neuropathy. (A) Principal component analysis plot of samples based on the regularised log2-transformed counts of novel LncRNAs and ENSEMBL genes (first 5000 genes ranked by their SD) in the rat DRG. Axis represents PCs and shows percentage of original data's variance explained by the respective PC. (B) Volcano plot of the whole gene set (ENSEMBL annotated genes and novel LncRNAs). X-axis Log2(Fold Change), y-axis −log10(FDR adjusted P value). Significantly DE ENSEMBL annotated genes and novel LncRNAs are highlighted. (C) Expression plot of novel antisense LncRNAs vs the sense protein-coding gene. (D) Heatmap of novel and annotated intergenic LncRNAs DE between SNT and Sham-operated animals. DE, differentially expressed; DRG, dorsal root ganglion; FDR, false discovery rate; LncRNAs, long noncoding RNAs; PCA, principal component analysis; SNT, spinal nerve transection.
Figure 7.
Figure 7.
Dorsal root ganglion transcriptional response in mice after peripheral neuropathy. (A) Hind paw withdrawal thresholds to von Frey filament stimulation + SEM in grams. We calculated the area over the curve (AOC) for each strain and obtained the percentage of maximum induced hypersensitivity. Two-way ANOVA showed a significant effect of surgery and a significant interaction of strain:surgery (P = 0.001). One-way ANOVA between SNI groups on D28 showed significant difference in % of maximum hypersensitivity (P = 0.002). Black bar shows comparison between SNI groups, P < 0.01**. N = 12 per strain, N = 6 per SNI group. (B) Principal component analysis plot of samples based on the expression of novel LncRNAs and ENSEMBL genes (first 10,000 genes ranked by their SD) in the mouse DRG. Axis represents PCs and show percentage of original data's variance explained by the respective PC. (C and D) Volcano plots of the whole gene set for BALB/c strain (C) and B10.D2 strain (D). X-axis Log2(Fold Change), y-axis −log10(FDR adjusted P value). Significantly DE ENSEMBL annotated genes and novel LncRNAs are highlighted. ANOVA, analysis of variance; DE, differentially expressed; DRG, dorsal root ganglion; FDR, false discovery rate; LncRNAs, long noncoding RNAs; SNI, spared nerve injury.
Figure 8.
Figure 8.
Network analysis of annotated genes and novel LncRNAs. (A) Heatmap of module membership for novel LncRNAs. Module membership quantified with absolute bicorrelation. Colours represent z-values of absolute bicorrelation. (B) Distribution of novel LncRNAs in modules enriched with GO terms of Biological Process (BP). GO, Gene Ontology; LncRNAs, long noncoding RNAs.
Figure 9.
Figure 9.
Expression patterns of LncRNAs in the mouse DRG. (A and B) Expression plot of annotated ENSEMBL antisense LncRNAs in the BALB/c mouse (A) and B10.D2 mouse (B). (C and D) Novel antisense LncRNAs vs the sense protein-coding gene in BALB/c (C) and B10.D2 (D) strains. Novel LncRNAs antisense to DE genes Inpp1, Epyc, Kcnmb1, Nefl, Nalcn, Nbea, Ttc39aos1, Cgref1, and Zyg11b are significantly DE. (E) Heatmap of novel and annotated intergenic LncRNAs DE between SNT and Sham-operated animals. (F) Hierarchical samples' clustering based on the expression of ENSEMBL annotated and novel LncRNAs in mice. Counts were transformed using the regularized log2 transformation; Euclidean distance was used as a dissimilarity measure and complete linkage was used for clustering. Male samples are in blue and female in pink colour. DE, differentially expressed; DRG, dorsal root ganglion; LncRNAs, long noncoding RNAs; SNI, spared nerve injury; SNT, spinal nerve transection.
Figure 10.
Figure 10.
Relative expression of 7 novel LncRNAs in the SNI vs Sham mouse DRG assessed by qPCR and RNA-seq. (A and C) Relative expression assessed by RNA-seq. RNA-seq counts were normalised by the sham average and the effective library size using DESeq2. Significance as obtained by DESeq2 using the following GLM ∼ sex + strain × condition for the whole gene set of ENSEMBL annotated genes and novel LncRNAs, N = 10 per strain (6 Sham–4 SNI BALB/c, 5 Sham–5 SNI B10.D2). (B and D) Relative expression assessed by qPCR. Expression was normalized against the average expression in Sham. Significance was obtained using a 1-way ANOVA and the linear model ∼ sex + condition, N = 10 per strain. (E) Relative expression of 7 novel LncRNAs in brain vs DRG. Expression was measured by qPCR using the delta CT method. Expression was normalized against the average expression in the brain. Data are presented as mean plus SEM. P < 0.05*, P < 0.01**, and P < 0.001***, same direction of change between RNA-seq and qPCR #. X indicates strand-specific RT-PCR, N = 8 for B10.D2 (5 Sham and 3 SNI). ANOVA, analysis of variance; DRG, dorsal root ganglion; LncRNAs, long noncoding RNAs; qPCR, quantitative real-time polymerase chain reaction; SNI, spared nerve injury.

References

    1. Abraira VE, Ginty DD. The sensory neurons of touch. Neuron 2013;79:618–39. - PMC - PubMed
    1. Alexa A, Rahnenfuhrer J. topGO: topGO: enrichment analysis for gene ontology. 2010. www.bioconductor.org. In R package version 3.4.4.
    1. Anders S, Pyl PT, Huber W. HTSeq—a Python framework to work with high-throughput sequencing data. Bioinformatics 2015;31:166–9. - PMC - PubMed
    1. Basbaum AI, Bautista DM, Scherrer G, Julius D. Cellular and molecular mechanisms of pain. Cell 2009;139:267–84. - PMC - PubMed
    1. van Brakel JP. Algorithm—peak signal detection in realtime timeseries data—stack overflow. 2014. Available at: https://stackoverflow.com/questions/22583391/peak-signal-detection-in-re.... Accessed May 1, 2018.