. 2018 Oct 18;13(10):e0204741.
doi: 10.1371/journal.pone.0204741. eCollection 2018.

Sensitivity of joint contagiousness and susceptibility-based dynamic optimal control strategies for HIV prevention

Affiliations

Sensitivity of joint contagiousness and susceptibility-based dynamic optimal control strategies for HIV prevention

Ingo Bulla et al. PLoS One. .

Erratum in

Abstract

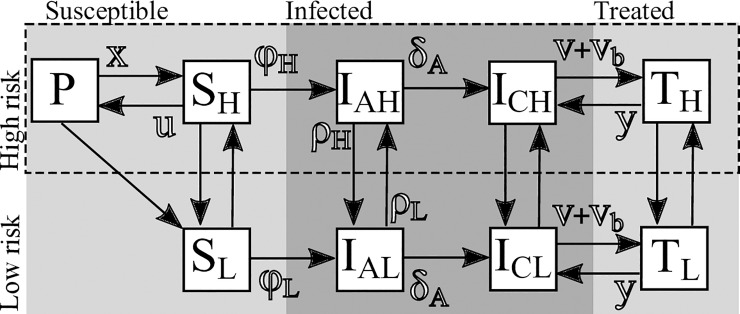
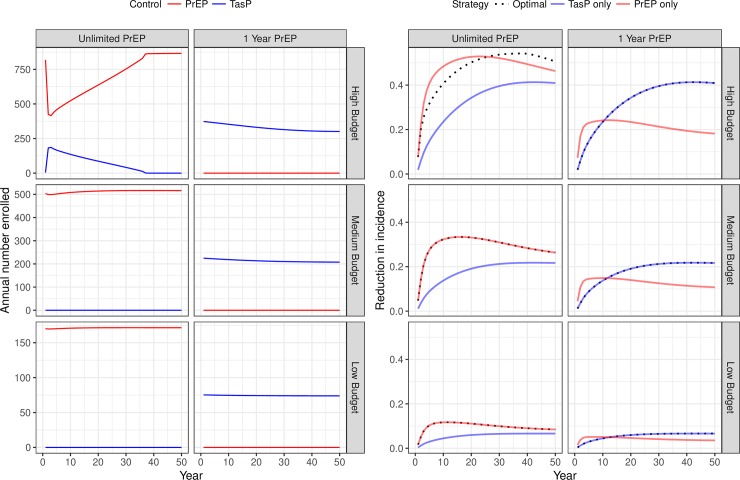
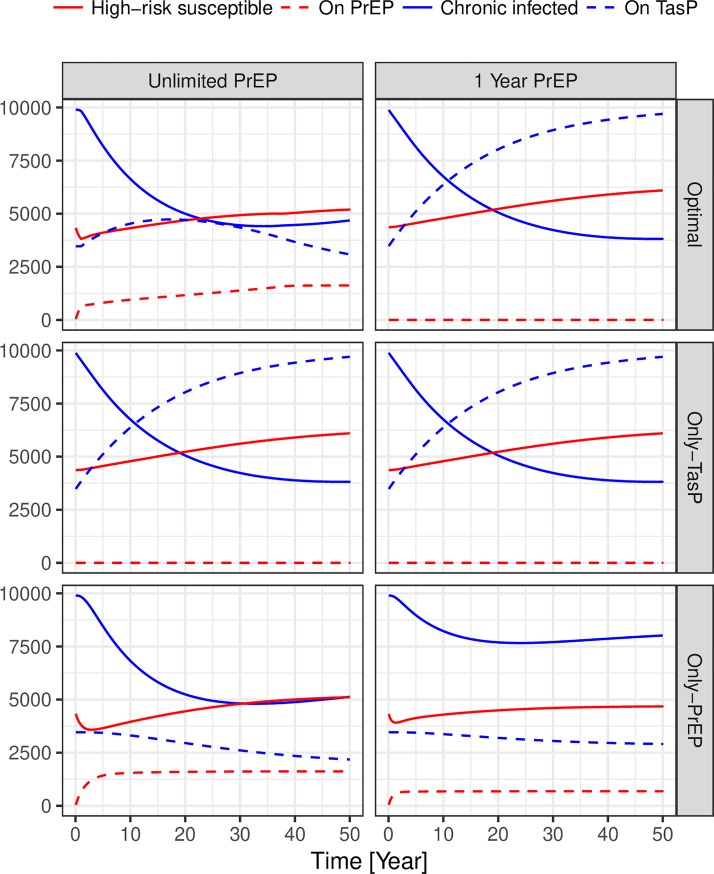
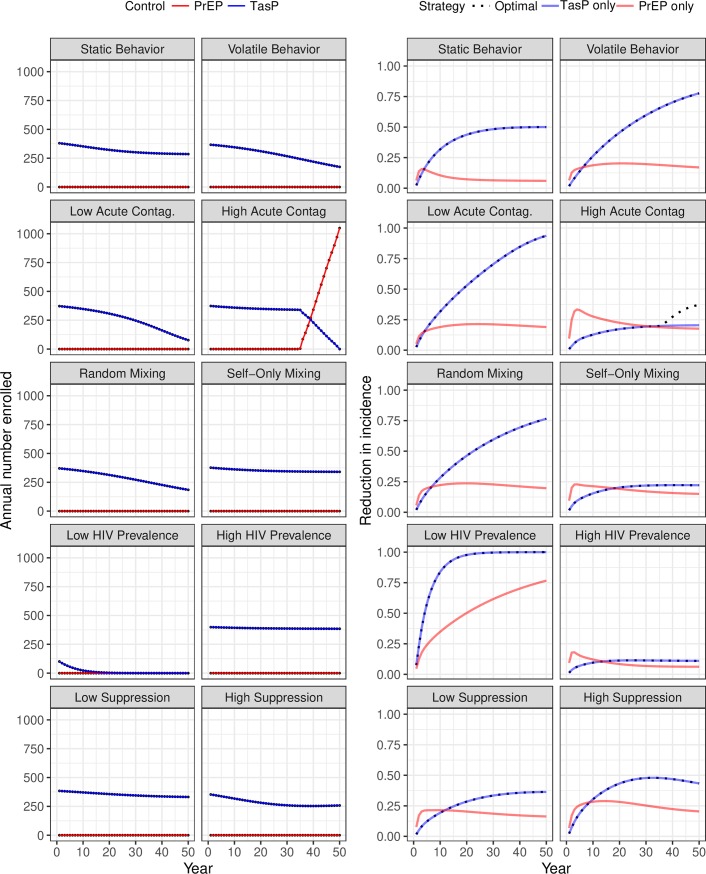
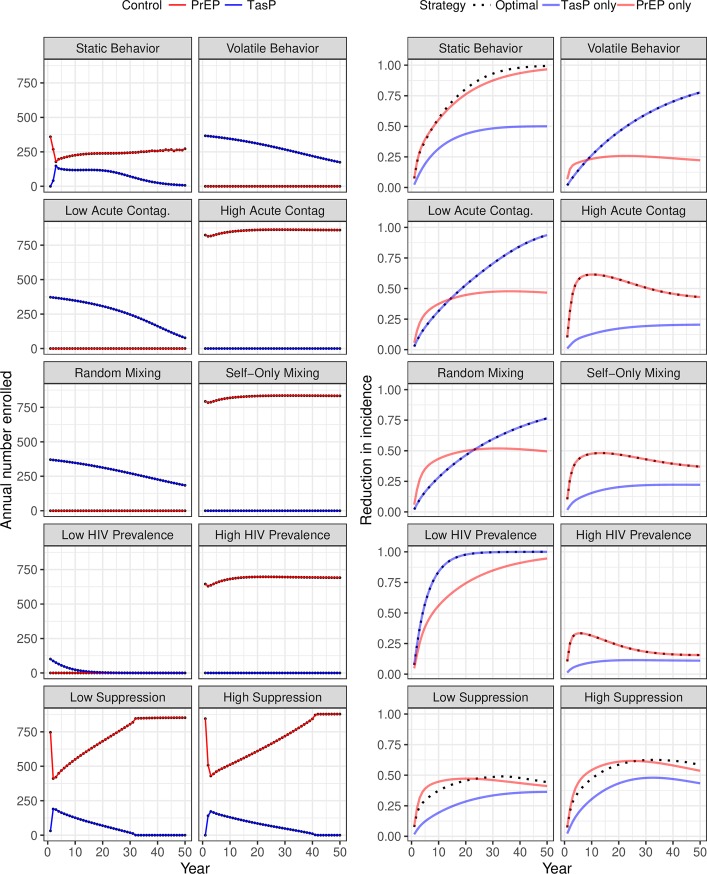
Predicting the population-level effects of an infectious disease intervention that incorporate multiple modes of intervention is complicated by the joint non-linear dynamics of both infection transmission and the intervention itself. In this paper, we consider the sensitivity of Dynamic Optimal Control Profiles (DOCPs) for the optimal joint investment in both a contagiousness and susceptibility-based control of HIV to bio-behavioral, economic, and programmatic assumptions. The DOCP is calculated using recently developed numerical algorithms that allow controls to be represented by a set of piecewise constant functions that maintain a constant yearly budget. Our transmission model assumes multiple stages of HIV infection corresponding to acute and chronic infection and both within- and between-individual behavioral heterogeneity. We parameterize a baseline scenario from a longitudinal study of sexual behavior in MSM and consider sensitivity of the DOCPs to deviations from that baseline scenario. In the baseline scenario, the primary determinant of the dominant control were programmatic factors, regardless of budget. In sensitivity analyses, the qualitative aspects of the optimal control policy were often robust to significant deviation in assumptions regarding transmission dynamics. In addition, we found several conditions in which long-term joint investment in both interventions was optimal. Our results suggest that modeling in the service of decision support for intervention design can improve population-level effects of a limited set of economic resources. We found that economic and programmatic factors were as important as the inherent transmission dynamics in determining population-level intervention effects. Given our finding that the DOCPs were robust to alternative biological and behavioral assumptions it may be possible to identify DOCPs even when the data are not sufficient to identify a transmission model.


Conflict of interest statement

The authors have declared that no competing interests exist.

Figures

Fig 1
Fig 1. Illustration of the transmission model.
The transmission model divides the population into 9 states (Treated High Risk, Treated Low Risk, Chronic High Risk, Chronic Low Risk, Actue High Risk, Acute Low Risk, Susceptible High Risk, Susceptible Low Risk, and Protected) represented by boxes. Flows between states are represented as arrows. Symbols represent rate coefficients and model parameters. The term ϕH and ϕL are complex terms involving both sexual mixing and contact rate terms.
Fig 2
Fig 2. Dynamic optimal control policies and intervention effects in the baseline scenario.
The left panel gives the optimal number of individuals annually enrolled in TasP (red) and PrEP (blue) for 1, 3, and 5 million dollars per year (low, medium, and high budgets respectively) and two different PrEP policies, “Unlimited PrEP” for PrEP provided for the entire duration of a high-risk period or “1-Year PrEP” for PrEP provided for 1 year. The right panel gives the multiplicative-scale reduction in annual incidence for the dynamic optimal (black dots), PrEP-only (blue), and TasP-only (red) control policies.
Fig 3
Fig 3. Number of possible enrollees and number enrolled on TasP and PrEP over time for the high-budget baseline scenario.
Each panel shows the number of possible enrollees for each intervention, high-risk susceptibles (SH) for PrEP and chronic infecteds (CH + CL) for TasP in solid red and blue lines respectively; and the number on each intervention in dashed red and blue lines for PrEP and TasP respectively. The vertical facets define the intervention allocation, the top row (“Optimal”) refers to the DOCP; in the 1-year PrEP case the optimal and only-TasP allocations are the same.
Fig 4
Fig 4. Sensitivity of dynamic optimal control policies and intervention effects to model formulation for the “1-Year PrEP” scenario given an annual budget of 5 million dollars.
The optimal number of annual enrollment into PrEP (red) and TasP (blue) interventions is plotted on the left while the multiplicative-scale annual reduction in annual incidence for the optimal (black dots), PrEP-only (blue), and TasP-only (red) interventions is plotted on the right. Each row represents a sensitivity axis where the baseline parameter set, (Fig 2), can be thought of as being between the two extremes of each axis. Parameter sets are described in the materials and methods section.
Fig 5
Fig 5. Sensitivity of dynamic optimal control policies and intervention effects to model formulation for the “Unlimited PrEP” scenario given an annual budget of 5 million dollars.
The optimal number of annual enrollment into PrEP (red) and TasP (blue) interventions is plotted on the left while the multiplicative-scale annual reduction in annual incidence for the optimal (black dots), PrEP-only (blue), and TasP-only (red) interventions is plotted on the right. Each row represents a sensitivity axis where the baseline parameter set, (Fig 2), can be thought of as being between the two extremes of each axis. Parameter sets are described in the materials and methods section.

Similar articles

Cited by

References

    1. Halloran ME. Overview of vaccine field studies: types of effects and designs. J Biopharm Stat. 2006;16: 415–427. 10.1080/10543400600719236 - DOI - PubMed
    1. Janes HE, Cohen KW, Frahm N, De Rosa SC, Sanchez B, Hural J, et al. Higher T-Cell Responses Induced by DNA/rAd5 HIV-1 Preventive Vaccine Are Associated With Lower HIV-1 Infection Risk in an Efficacy Trial. J Infect Dis. 2017;215: 1376–1385. 10.1093/infdis/jix086 - DOI - PMC - PubMed
    1. Blanchard JF, Aral SO. Program Science: an initiative to improve the planning, implementation and evaluation of HIV/sexually transmitted infection prevention programmes. Sex Transm Infect. 2011;87: 2–3. 10.1136/sti.2010.047555 - DOI - PubMed
    1. Aral SO, Blanchard JF. The Program Science initiative: improving the planning, implementation and evaluation of HIV/STI prevention programs. Sex Transm Infect. 2012;88: 157–159. 10.1136/sextrans-2011-050389 - DOI - PubMed
    1. Gromov D, Bulla I, Silvia Serea O, Romero-Severson EO. Numerical optimal control for HIV prevention with dynamic budget allocation. Math Med Biol J IMA. 2017; 10.1093/imammb/dqx015 - DOI - PubMed

Publication types

MeSH terms