Review
. 2018 Nov 28;118(22):11194-11258.
doi: 10.1021/acs.chemrev.8b00369. Epub 2018 Oct 18.

Enzymatic Transition States and Drug Design

Affiliations
Review

Enzymatic Transition States and Drug Design

Vern L Schramm. Chem Rev. .

Abstract

Transition state theory teaches that chemically stable mimics of enzymatic transition states will bind tightly to their cognate enzymes. Kinetic isotope effects combined with computational quantum chemistry provides enzymatic transition state information with sufficient fidelity to design transition state analogues. Examples are selected from various stages of drug development to demonstrate the application of transition state theory, inhibitor design, physicochemical characterization of transition state analogues, and their progress in drug development.


Conflict of interest statement

The author declares the following competing financial interest(s): The author serves as a consultant or board member to several biotech companies involved in development of the immucillin family of transition state analogues, some of them described here. The intellectual property developed around these inhibitors is the joint property of the Albert Einstein College of Medicine and Victoria University of Wellington, New Zealand. The author and collaborators receive royalties through dividend plans of these institutions.

Figures

Figure 1
Figure 1
Thermodynamic box for describing the equilibrium binding constant of the transition state as described by Pauling and formalized by Wolfenden. E and A are enzyme and reactant, kchem and kenz are the rates of transition state formation without and with enzyme, and Kd and Kd‡ are dissociation constants for the Michaelis and transition state complexes, respectively.
Figure 2
Figure 2
Enzymatic synthesis of radiolabeled reactants PRPP from specifically labeled glucose or ribose. Product of a single-pot coupled synthesis yields ATP. Subsequent conversions to AMP, PRPP, inosine, and adenosine are shown. Isotopic labels in any of the reactants can be used to label the desired position in products. Other transferases can replace APRTase to generate other nucleotides as intermediates or products.
Figure 3
Figure 3
Crystal structure of E. coli AMP nucleosidase hexamer with formycin 5′-phosphate at the catalytic sites (A), and detailed contacts between the enzyme and formycin 5′-phosphate at the catalytic sites (B). Catalytic site contacts are from the parental and adjacent (*) subunit contacts. From PDB structure 1T8S. Adapted with permission from ref . Copyright 2004 Elsevier.
Figure 4
Figure 4
Kinetic isotope effects for [1′–14C]AMP primary effect and [1′–3H]AMP α-secondary effect with different enzyme conditions and compared to the acid-catalyzed solvolysis of AMP in 0.1 M HCl at 50 °C., % KIE = 100% (KIE – 1.000).
Figure 5
Figure 5
Formycin 5′-phosphate differs from AMP by a chemically stable C–C ribosidic bond and elevated pKa at N7 to mimic protonation of this group at the transition state.
Figure 6
Figure 6
Substrate 2′-deoxyadenosine (2′-dAdo) enzyme-stabilized intermediate at the catalytic site and the natural product transition state analogue inhibitor, deoxycoformycin. The Zn2+-activated water nucleophile is shown. In clinical use, the analogue is known as pentostatin.
Figure 7
Figure 7
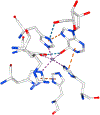
Zn2+ cation at the catalytic site of bovine adenosine deaminase from PDB 1FKX, D296A mutant. Zn2+ ion is the central sphere in the figure and is in contact with the protein ligands and the 6-hydroxyl group of 6-hydroxydihydroadenosine.
Figure 8
Figure 8
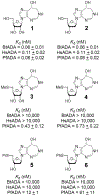
Dissociation constants (Kd) for inhibiton of ADAs from bovine (Bt), human (Hs), and Plasmodium falciparum (Pf) sources. Reproduced from ref . Copyright 2007 American Chemical Society.
Figure 9
Figure 9
Reaction coordinate and transition state structures for the P. falciparum (PfADA), human (HsADA), and bovine (BrADA) transition states with molecular electrostatic potential maps of reactant, transition state, and product. Reproduced from ref . Copyright 2007 American Chemical Society.
Figure 10
Figure 10
Kinetic isotope effects and bond lengths(Angstroms)at the transition state of CfNH. The N-ribosidic bond is nearly cleaved, with weak nucleophilic participation to form a partially developed ribocation.
Figure 11
Figure 11
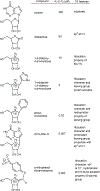
Chemical features of the transition state for CfNH incorporated into candidates as transition state analogues.
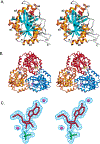
Figure 12
Figure 12
Stereoviews of a transition state analogue bound to the catalytic site of CfNH. Upper panel shows the contacts to the catalytic site Ca2+, and lower panel indicates the contacts to the pAPIR transition state analogue. Reproduced from ref . Copyright 1996 American Chemical Society.
Figure 13
Figure 13
Distance map for the catalytic site of CfNH with contacts to the catalytic site and pAPIR as a catalytic site ligand. His82 is 3.6 Å from the leaving group and has been considered a potential leaving group proton donor. Note the 2.7 Å neighboring group interaction between O5′ and O4′. Reproduced from ref . Copyright 1996 American Chemical Society.
Figure 14
Figure 14
Interaction map for the catalytic site of TvNH with contacts to the catalytic site Ca2+ and inosine as a catalytic site ligand. Asp10Ala mutant prevented hydrolysis of the inosine. Trp83 and Trp260 are stacked with the leaving group. Reproduced with permission from ref . Copyright 2006 Elsevier.
Figure 15
Figure 15
Analogues of the transition states for IU-NH (CfNH) and IAG-NH (TbbNH) demonstrating ribocation and leaving group interaction differences.,
Figure 16
Figure 16
ADP ribosylation of eukaryotic elongation factor 2 (eEF2), G-stimulatory protein α, and G-inhibitory protein α by diphtheria, pertussis, and cholera toxins, respectively. Attacking nucleophile atoms are designated by the electrons. Note the inversion of configuration at C1 of the ribosyl group.
Figure 17
Figure 17
(A) Synthesis of isotopically labeled [1′–14C]NAD+ by coupled enzymatic reactions. Enzymes are (1) hexokinase, (2) glucose 6-phosphate dehydrogenase, (3) 6-phosphogluconate dehydrogenase, (4) 5-phosphoriboisomerase, (5) 5-phosphoribosyl 1-pyrophosphate synthatase, (6) nicotinate phosphoribosyltransferase, (7) NAD+ pyrophosphorylase, (8) pyruvate kinase, (9) glutamate dehydrogenase, and (10) adenylate kinase. Single-pot incubation (steps 1–10) converts glucose to NaAd+. Reaction is stopped at step 11; NaAD+ is purified and converted to NAD+ by NAD+ synthetase (12). Different labels in the starting glucose or the nicotinic acid added in step 6 provide NAD+ with any desired label in the NMN+ portion of the molecule. From the method of Figure 2, label can be placed at any position in ATP and incorporated into the AMP portion of NAD+ by incorporation at step (B) Reaction coordinate distances for ADP-ribosylating cholera, pertussis, and diphtheria toxins at their transition states as determined by kinetic isotope effect analysis. All distances are in Angstroms. Hydrolysis refers to the toxin-catalyzed solvolysis of NAD+ in the absence of the protein nucleophile ADP-ribosylation acceptor. All of these toxins catalyze NAD+ solvolysis. ADP-ribosyl transferase activity to Gαi3 peptide for pertussis toxin is to the C20-terminal peptide in which transfer occurs to Cys at amino acid 4 of the peptide. ADP-ribosyl transferase to eEF-2 used full-length eEF2 isolated from baker’s yeast.
Figure 18
Figure 18
Design of transition state analogues for ADP-ribosylating cholera, pertussis, and diphtheria toxins. Features of the ribocation are provided by the hydroxypyrrolidine, a long bond to the leaving group is provided by the methylene bridge, and recognition elements of the carboxamide group are retained.
Figure 19
Figure 19
Chemical synthetic scheme for 3-hydroxypyrrolidine transition state analogues for ADP-ribosylating cholera, pertussis, and diphtheria toxins.
Figure 20
Figure 20
Transition state structure of ricin A-chain acting on stem– loop RNA at pH 4.0. (Upper left) Reactant adenylate electrostatic potential at the van der Waals surface. (Upper right) Transition state electrostatic potential showing fully dissociated adenine. Reproduced from ref . Copyright 2000 American Chemical Society.
Figure 21
Figure 21
Synthetic route to hydroxypyrrolidine transition state analogues of ribosome-inactivating proteins: (i) DMTrCl (1.5 equiv), DMAP (catalytic), (iPr)2NEt (2 equiv), pyridine, room temperature, 5 h; (ii) 2-cyanoethyl N,N-diisopropylchlorophosphoramidite (2.5 equiv), 2,4,6-collidine (2.5 equiv), 1-methylimidazole (1 equiv), methylene chloride, 0 °C, 30 min; (iii) Expedite DNA/RNA synthesis system. Reproduced from ref . Copyright 2004 American Chemical Society.
Figure 22
Figure 22
Transition state analogue inhibitors of ricin A-chain. 1N, DA, BZ, and deoxyG (dG) inserts into the stem–loop structures replace adenosine at the depurination site for the reaction and are shown below the respective stem loops.
Figure 23
Figure 23
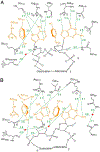
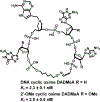
Catalytic site contact maps of ricin A-chain (A) and saporin L3 (B) with a cyclic transition state analogue inhibitor bound to the active sites. Purines and catalytic site groups involved in π-stacking are in orange. Water molecules are drawn as red dots. Hydrogen bonds are shown as dashed lines (green). Hydrogen bonds are in Angstroms. Reproduced with permission from ref . Copyright 2009 Proceedings of the National Academy of Sciences.
Figure 24
Figure 24
Transition state geometry, electrostatic potential surface (EPS), and NBO charges for the reaction of saporin L3. Transition state geometry (a), EPS values for transition state (b), reactant (c), and products (d) are shown. nuc is the nucleophilic water. Reproduced from ref . Copyright 2016 American Chemical Society.
Figure 25
Figure 25
Transition state analogues for saporin L3. Structure is covalently closed and O2′ protected from RNases. It provided a scaffold for A of both ricin A-chain and saporin L3 (Figure 23).
Figure 26
Figure 26
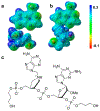
Comparison of electrostatic potentials for the transition state (a) of saporin L3 and the transition state mimic (b) of a truncated 2-base transition state mimic (c). This truncated inhibitor is a 3.3 nM TS analogue. Reproduced from ref . Copyright 2016 American Chemical Society.
Figure 27
Figure 27
Catalytic site contact map for human HGPRT in complex with ImmGP. Light green circles represent crystallographic water oxygens. O2A is the nearest to the reaction center and is proposed to be the nucleophilic oxygen.
Figure 28
Figure 28
Catalytic site contact map for P. falciparum HGXPRT in complex with ImmHP. Similar to the structure of the human enzyme, O2A is the nearest to the reaction center and is proposed to be the nucleophilic oxygen and the O5′–N4′ distance is 2.7 Å. Reproduced from ref . Copyright 1999 American Chemical Society.
Figure 29
Figure 29
Acyclic aza-C-nucleoside phosphonate inhibitors of P. falciparum HGXPRT.
Figure 30
Figure 30
Synthetic strategy for one family of the acyclic aza-C-nucleoside phosphonate inhibitors: (a) triethyl phosphite, 120 °C; (b) H2NNH2, EtOH; (c) NaBH4, EtOH; (d) 35% aq HCl, 60 °C; (e) 48% HBr 90 °C; (f) 2-picoline borane, MeOH. Reproduced with permission from ref . Copyright 2013 Elsevier.
Figure 31
Figure 31
Lysophospholipid prodrug approaches to antimalarials. Prodrug approach summarized in the text was adapted to the AIPs. (A) Phospholipase specificity pattern. (B) Synthetic approach to prevent phospholipase A and D action. Table provides the specific substituents in B and the IC50 values for growth of P. falciparum parasites in human erythrocytes. Reproduced with permission from ref . Copyright 2012 Elsevier.
Figure 32
Figure 32
Active site of Pf HGXPRT bound to the 0.65 nM inhibitor of Figure 29 and MgPPi. Hydrogen bonds are represented as dashed lines. All distances are in Angstroms. Two-dimensional representation of the active site where the ionic bond between pyrophosphate and the ribocation mimic is represented as a thick dashed line. Water molecules are represented as red dots, and the hydrophobic residues interacting with the purine ring are drawn in orange. Reproduced with permission from ref . Copyright 2012 Elsevier.
Figure 33
Figure 33
Reaction, transition state, and proposed transition state analogue inhibitors for P. falciparum and human OPRT-catalyzed OMP pyrophosphorolysis. OPRT transition states are characterized by fully dissociated dianionic orotate, a ribocation, and weak nucleophile (PPi) participation. Iminoribitol, pyrrolidine, or acyclic ribocation groups as mimics of the ribocation were proposed. Methylene or ethylene linkers resemble the extended bond distance to approximate the transition state. PRPP, 5-phospho-α-D-ribosyl 1-pyrophosphate. Reproduced with permission from ref . Copyright 2013 American Society for Biochemistry and Molecular Biology.
Figure 34
Figure 34
Inhibition constants (nM) for potential transition state analogues of P. falciparum (blue) and human (red) OPRT enzymes. Reproduced with permission from ref . Copyright 2013 American Society for Biochemistry and Molecular Biology.
Figure 35
Figure 35
Synthesis of the amidrazone 10, reported to be an inhibitor of yeast OPRT. (a) (BnO)2PO2H, DEAD, THF, 2 h, 25 °C; (b) Et3O+PF6–, CH2Cl2, 2 h, 25 °C; (c) o-hydrazinoPhCO2H, i-Pr2Net, CH2Cl2, 16 h, 25 °C; dil aq HCl; (d) 8 M HCl, 16 h, 25 °C. Reproduced with permission from ref . Copyright 2006 Elsevier.
Figure 36
Figure 36
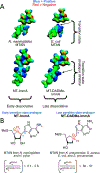
Arsenolysis reaction catalyzed by MTAP, transition state structure, and intrinsic KIE values used to determine the transition state structure.
Figure 37
Figure 37
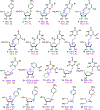
Transition state analogues synthesized to resemble the transition state structure of human MTAP and their dissociation constants.,
Figure 38
Figure 38
Hypothetical mechanism of action for MTDIA, a transition state analogue inhibitor of MTAP. MeTR1P is 5-methylthioribose 1-phosphate, and CpG-DNA refers to the DNA methylation sites at CpG islands. AdoHcy is adenosyl homocysteine, Hcy is homocysteine, Ado is adenosine, and Met is methionine.
Figure 39
Figure 39
Human MTAP stereoviews of monomer (A) with bound MT-ImmA and phosphate (red) and trimer (B), and electron density omit map for bound MT-ImmA, phosphate, and two ordered water molecules (C). Reproduced from ref . Copyright 2004 American Chemical Society.
Figure 40
Figure 40
Contacts for MTAP·MTA·SO4 (A) compared to MTAP·MT-ImmA·PO4 (B). Significant changes are in bold for the MTAP·MT-ImmA· PO4 structure. L279B and H137B are from the neighbor subunit and participate in van der Waals interactions. Reproduced from ref . Copyright 2004 American Chemical Society.
Figure 41
Figure 41
Stereoview of the MTAP catalytic site in complex with pClPhT-DADMe-ImmA and phosphate. Active site residues and those from the adjacent subunit are colored in yellow and cyan, respectively. p-Cl-PhT-DADMe-ImmA and phosphate are colored in gray and orange/red, respectively. Hydrogen bonds (<3.1 Å) are indicated as dashed lines. Reproduced from ref . Copyright 2011 American Chemical Society.
Figure 42
Figure 42
Thermodynamic signatures for the binding of adenine and transition state analogues to human MTAP·PO4. Reproduced from ref . Copyright 2011 American Chemical Society.
Figure 43
Figure 43
Heat capacity changes and optimal binding temperatures for MTAP. (A) ΔCp for inhibitor binding. DADMe-ImmH binding to PNP (9 pM) is included as a control. (B) Free energy of inhibitor binding to MTAP as a function of temperature. Optimal binding temperature is the minima. DADMe-ImmH binding to PNP is added for comparison. Reproduced from ref . Copyright 2016 American Chemical Society.
Figure 44
Figure 44
Thermodynamic box for the cooperative binding of phosphate and MT-DADMe-ImmA to human MTAP.
Figure 45
Figure 45
Functions of the bacterial MTANs. Abbreviations: S-adenosylhomocysteine (SAH), 5′-deoxyadenosine (5′-DOA), S-ribosyl homocysteine (SRH), and 5-methylthioribose (MTR). Autoinducer-2 molecules are formed from 4,5-dihydroxy-2,3-pentadione.
Figure 46
Figure 46
(A) Molecular electrostatic potentials of early and late dissociative MTAN transition states compared to MT-ImmA, MT-DADMe-ImmA, early and late transition state analogues. Arrows indicate partial positive charge around C1′ of the E. coli transition state, mimicked at the 1′-pyrolidine nitrogen of MT-DADMe-ImmA and 4′-iminoribitol nitrogen of MT-ImmA. (B) Transition state analogue specificity for early and late transition states. Reproduced from refs and . Copyright 2007 American Chemical Society.
Figure 47
Figure 47
Transition state analogues for E. coli MTAN. These are all slow-onset tight-binding inhibitors as indicated by the Ki* designation. Values are for the equilibrium binding constant following slow-onset inhibition. These 5′-substituted-DADMe-ImmA molecules are late transition state analogues to mimic the late, dissociative transition state of E. coli MTAN (Figure 46). Selected Ki values are compared for V. cholerae and H. pylori isozymes in Figure 49.
Figure 48
Figure 48
Molecular electrostatic potential surfaces (MEPs) for (a) the transition state of E. coli MTAN, (b) MT-ImmA, (c) MT-DADMe-ImmA, and (d) pClPhT-DADMe-ImmA. MEPs were calculated in Gaussian98/cube for the optimized geometry and visualized with Molekel 4.0 at a density of 0.008 electron/b. Stick models have the same geometry as the MEP surfaces. Values of Kd are dissociation constants for the inhibitors following slow-onset inhibition or Ki* in slow-onset analysis. Reproduced from ref . Copyright 2005 American Chemical Society.
Figure 49
Figure 49
Examples of transition state analogue affinity for E. coli, V. cholera, and H. pylori MTANs. These are slow-onset tight-binding inhibitors. Values are for the equilibrium binding dissociation constants following slow-onset inhibition. nd = not reported.
Figure 50
Figure 50
Thermodynamic profiles of ΔH, –TΔS, and ΔG for the binding of first-and second-generation inhibitors to the first active site of E. coli MTAN, S. enterica MTAN, and V. cholera MTAN. Reproduced from ref . Copyright 2012 American Chemical Society.
Figure 51
Figure 51
Root-mean-square fluctuation (RMSF) of individual BuT-DADMe-ImmA heavy atoms when occupying the E. coli MTAN active site (red) compared with the V. cholerae MTAN active site (blue). Reproduced from ref . Copyright 2013 American Chemical Society.
Figure 52
Figure 52
Inhibitor–enzyme contacts for V. cholerae and E. coli MTANs with DADMe-Immucillin transition state analogues. Data are taken from the Protein Data Bank (PDB) entries 3DP9 and 1Y6Q, respectively. All distances (Angstroms) are between heavy (non-hydrogen) atoms. Backbone RMSD of these active site amino acids from crystal structures is 0.4 Å. Distances in black are from structure of E. coli MTAN in complex with MT-DADMe-ImmA. Those in blue are from the structure of V. cholerae MTAN in complex with BuT-DADMe-ImmA.
Figure 53
Figure 53
Inhibition of AI-2 quorum sensing in overnight cultures of V. cholerae by increasing concentrations of BuT-DADMe-ImmA. No growth inhibition was observed. Reproduced with permission from ref . Copyright 2009 Nature Publishing.
Figure 54
Figure 54
Synthesis of menaquinone (MK) in E. coli and S. coelicolor. SEPHCHC, 2-succinyl-5-enolpyruvyl-6-hydroxy-3-cyclohexene-1-carboxylate; SHCHC, (1R,6R)-2-succinyl-6-hydroxy-2,4-cyclohexadiene-1-carboxylate; DHNA, 1,4-dihydroxy-2-naphthoate. Pathway enzymes: E. coli Men proteins: MenF, isochorismate synthase; MenD, SEPHCHC synthase; MenH, SHCHC synthase; MenC, o-succinylbenzoate (OSB) synthase; MenE, OSB-CoA synthase; MenB, DHNA-CoA synthase; Ydil, DHNA-CoA thioesterase; MenA, DHNA polyprenyltransferase; MenG, demethylmena-quinone/demethylphylloquinone methyltransferase; MqnA (SCO4506), chorismate dehydratase; MqnE (SCO4494), aminofutalosine synthase; MqnB (SCO4327), aminofutalosine hydrolase; MqnC (SCO4550), DHFL cyclase; MqnD (SCO4326), DHNA synthase; MqnX, amino-deoxyfutalosine deaminase. Compounds are depicted in their quinol forms. Conversion of menaquinol to MK is believed to be nonenzymatic. Reproduced with permission from Biocatalytic Potential of Enzymes Involved in the Biosynthesis of Isoprenoid Quinones. Chemcatchem 2018, 9, 124–135. Copyright 2018 Wiley Online Library.
Figure 55
Figure 55
Catalytic site contacts for H. pylori MTAN in complex with BuT-DADMe-ImmA. Reproduced from ref . Copyright 2012 American Chemical Society.
Figure 56
Figure 56
Transition state analogue inhibitors selected for low IC90 values for growth of H. pylori. Directed chemical library of transition state analogue inhibitors was synthesized and tested for inhibition of H. pylori MTAN and for bacterial growth inhibition. Reproduced from ref with permission. Copyright 2018 American Chemical Society.
Figure 57
Figure 57
MTAN from H. pylori bound to R = butyl for the 1-substituted 2-aminopropanol adducts of 9-deazaadenine. (Left) Electron density of 1RMSD for the bound ligand. For maps calculated with 2FobsFcalc coefficients. (Right) Surface representation of the MTAN protein surface showing the buried 9-deazaadenine and the hydrophobic channel leading to the solvent. PDB entry 4YO8. Reproduced from ref . Copyright 2015 American Chemical Society.
Figure 58
Figure 58
Comparing transition state analogue inhibitors for growth of H. pylori to current antibiotic therapy agents.
Figure 59
Figure 59
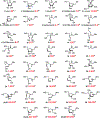
Intrinsic KIE values for the arsenolysis of inosine by bovine and human PNPs. Each KIE shown here was measured in independent experiments with an inosine molecule isotopically labeled in the indicated positions.,
Figure 60
Figure 60
PNP reactants, transition state structures, and transition state analogues: (A) Bovine PNP; (B) human PNP.,
Figure 61
Figure 61
Synthesis of the DADMe-Immucillins by the Mannich reaction. Conditions: (a) 30% aqueous formaldehyde, NaOAc, H2O, 95 °C. R1 = OH, SBn, SPhpCl, or OAc. R2 = OH or OAc. R3 = OH, NH2, Cl, or N3. R4 = H or NH2.
Figure 62
Figure 62
Catalytic site contacts in the complexes of bovine PNP–inosine–SO4, PNP–ImmH–PO4, and PNP–ImmG-PO4. Distances (in Angstroms) in panels a, b, and c are from Protein Data Base files 1A9S, 1B8O, and 1B8N, respectively. Interactions shown in b and c that are 0.2 Å or more closer than those in panel a are shown in red, and those that are 0.2 Å or more distant in panels b and c than in panel a are shown in blue. All contacts of 3.0 Å or closer are shown together with selected contacts > 3.0 Å for important interactions. Reproduced from ref . Copyright 2001 American Chemical Society.
Figure 63
Figure 63
Transition state analogue variants to test the effect of catalytic site contacts in bovine PNP as indicated in Figure 62. Note the difference in units from pM to μM. Compound numbers 1 and 2 are ImmH and ImmG, respectively. Energetic contributions from important interactions are summarized in Figure 64. Reproduced from ref . Copyright 2002 American Chemical Society.
Figure 64
Figure 64
Energetic differences caused by atomic subustitutions in transition state analogues of bovine PNP. Values are energentic differences expressed in ΔG, kcal/mol, between 1 (ImmH) and the other compounds from Figure 63, as expressed in the subscripts. Reproduced from ref . Copyright 2002 American Chemical Society.
Figure 65
Figure 65
Reaction coordinate motion in bovine PNP based on the crystal structures with ImmH and phosphate bound (gray) compared to enzyme with hypoxanthine and ribose 1-phosphate bound (red).
Figure 66
Figure 66
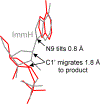
Human PNP catalytic site distances for ImmH and DADMe-ImmH bound at the catalytic sites with SO4 as the nucleophile analogue. Red dashed line highlighted in yellow represents the reaction coordinate distances in the normal reaction. From PDB structures 1RSZ and 3BGS.
Figure 67
Figure 67
Isotope labels in ImmH (left) and DADMe-ImmH (right) to compare bond distortions at these bonds for inhibitors in solution or bound at the catalytic sites of human PNP. Blue arrows indicate atomic interactions for REDOR distance measurements, and blue brackets are for R2 homonuclear distance measurements. Reproduced with permission from ref . Copyright 2013 National Academy of Sciences.
Figure 68
Figure 68
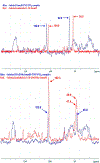
Magic angle spinning solid-state NMR of labeled ImmH (upper panel) and DADMe-ImmH (lower panel) to compare bond distortions. Peaks at 108.6 and 104 ppm are the 9-13C in bound and free ImmH. Peaks at 62.9 and 54.0 are the 1′–13C label in bound and free ImmH. Peaks at 103.0 ppm and 102.3 ppm are the 9-13C label in bound and free DADMe-ImmH. Peaks at 47.4 and 45.8 ppm are the 13CH2 in diastereomers of free protonated DADMe-ImmH. Pak at 45.0 ppm corresponds to the 13CH2 label in the sole diastereomer present in PNP-bound protonated DADMe-ImmH. Reproduced with permission from ref . Copyright 2013 National Academy of Sciences.
Figure 69
Figure 69
Internuclear distance changes for ImmH (left) and DADMe-ImmH (right) comparing bonds for inhibitors in solution or bound at the catalytic sites of human PNP. Reproduced with permission from ref . Copyright 2013 National Academy of Sciences.
Figure 70
Figure 70
Energetic differences caused by atomic subustitutions in transition state analogues of human PNP. Values are energentic differences, expressed in ΔΔG, kcal/mol, between DADMe-ImmH and related compounds with the atomic substutions indicated by the arrows.
Figure 71
Figure 71
Dissociation constants for human PNP comparing cyclic with acyclic Immucillins. Compounds marked with an asterisk exhibited slow-onset inhibition kinetics. Values are equilibrium dissociation constants in pM. Source of Ki values. Reproduced from ref . Copyright 2009 American Chemical Society.
Figure 72
Figure 72
Catalytic site contacts between human PNP, DATMe-ImmH, and SerMe-ImmH transition state analogue inhibitors with sulfate or phosphate. Relative distance between inhibitors and the surrounding catalytic site residues is shown in Angstroms. Adapted with permission from ref . Copyright 2010 National Academy of Sciences.
Figure 73
Figure 73
Role of PNP deficiency in dGuo accumulation and T-cell toxicity. DNA recycling generates dGuo which accumulates in the absence of PNP activity. dGuo is phosphorylated in activated T cells by their elevated dCK activity. High levels of dGTP inhibit ribonucleotide diphosphate reductase (RDR). Activated T cells induce dCK and repress 5′-nucleotidases (5′-NT). Reproduced with permission from ref . Copyright 2001 National Academy of Sciences.
Figure 74
Figure 74
SCID mouse–human T-cell autoimmune rejection model. In this trial, ImmH is designated BCX-1777. Reproduced with permission from ref . Copyright 2001 Elsevier.
Figure 75
Figure 75
DADMe-ImmH (called Ulodestin in this trial) lowers serum urate in combination with allopurinol in gout patients. Percent of patients achieving serum urate less than 6.0 mg/dL for Ulodesine and Allopurinol dosing groups.. Reproduced with permission from ref . Copyright 2014 Elsevier.
Figure 76
Figure 76
Single oral administration of DADMe-ImmH (Ulodesine in this trial) rapidly inhibited erythrocyte PNP activity in normal human volunteers. Reproduced with permission from ref . Copyright 2017 American Society of Biochemistry and Molecular Biology.
Figure 77
Figure 77
Cartoon showing the rebinding (kon) of DADMe-ImmH inside human erythrocytes. As the intrinsic koff (t½) rate is 8.3 min, the on rate is required to be >10 000 more rapid, >20 s−1. Reproduced with permission from ref . Copyright 2017 American Society of Biochemistry and Molecular Biology.
Figure 78
Figure 78
Catalytic site contacts for ImmH and SO4 at the catalytic sites of Pf PNP (PDB ID 1NW4) (a) compared with MT-ImmH and SO4 in PfPNP (PDB ID 1Q1G) (b) and ImmH and PO4 in bovine PNP (PDB ID 1B80) (c). Amino acid residues labeled a in panels a and b are from the parent subunit, and those labeled b are from the neighbor subunit across the dimeric interface. Distances are given in Angstroms. Reproduced with permission from ref . Copyright 2004 American Society of Biochemistry and Molecular Biology.
Figure 79
Figure 79
Catalytic site contacts for MT-coformycin (upper panel) and deoxycoformycin (lower panel) at the catalytic sites of PvADA. Relative position of MT-coformycin (PDB entry 3EWC) compared to deoxycoformycin (PDB entry 2PGR) and the active site residues of PvADA. The water molecule is drawn as a dot in the upper panel. Hydrogen bonds and zinc ion interactions are depicted as dashed lines. Distances are given in Angstroms.
Figure 80
Figure 80
Purine salvage pathways for formation and utilization of hypoxanthine in human erythrocytes and in P. falciparum parasites. Horizontal arrows indicate transport from red blood cells (RBCs) to the parasite. ADA, PNP, and HGXPRT are adenosine deaminase, purine nucleoside phosphorylase, and hypoxanthine-guanine-xanthine phosphoribosyltransferase. Structures of the human and Plasmodium PNPs are indicated.
Figure 81
Figure 81
Blood P. falciparum counts in infected control Aotus (IUM, n = 1) or infected treated monkeys (ITM, n = 3). Arrow indicates mefloquine cure of the Aotus control. Shaded bar on the abscissa indicates DADMe-ImmG treatment days. Reproduced with permission from ref . Creative Commons 2011 Attribution License. during Aotus infections caused the erythrocyte hypoxanthine to decrease to undetectable levels (<0.3 μM). Inhibition at PNP caused the blood inosine to increase to 50 μM, demonstrating the metabolic block at PNP. It is anticipated that hypoxanthine starvation therapy would be more successful in humans, but to date, there are no reports of this therapy in clinical trials.
Figure 82
Figure 82
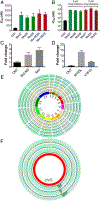
Characteristics of P. falciparum resistant to DADMe-ImmG. (A) IC50 values for P. falciparum growth for clones with 5.5–7.2-fold increased IC50 values. (B) IC50 values for P. falciparum growth for clones with 260–980-fold increased IC50 values. (C) Western blot intensity for PfPNP protein in drug-resistant clones. (D) Western blot intensity from highly resistant clones. (E) P. falciparum chromosomes (innermost circle). Peak height is relative to genomic reads of 10 kb contiguous regions. Three control clones (inner tracks) show no amplified regions. Three outer tracks correspond to 2 μM DADMe-ImmG-resistant isolates. Amplified Pf PNP regions are seen in all resistant strains in chr5. (F) Gene amplification in chr5 for three highly–resistant clones. Clones have distinct boundaries for gene amplification, each containing the coding region for the PfPNP gene. Reproduces with permission from ref . Copyright 2018 National Academy of Sciences.
Figure 83
Figure 83
Crystal structure of TvPNP with ImmA or DADMe-ImmA and PO4 bound in the active site. The asymmetric unit was used to generate the hexamer by applying 2-fold crystallographic symmetry (upper panel). Monomer pairs are represented with similar colors. (Lower panel) Superposition of the Immucillins at the active sites of the two TvPNP structures. The complex with ImmA is in pink, and the complex with DADMe-ImmA is in cyan. H4* is a catalytic site interaction from the adjacent subunit. Reproduced from ref . Copyright 2006 American Chemical Society.
Figure 84
Figure 84
Omit maps for ImmA, DADMe-ImmA, and phosphate (3σ) around the inhibitors (green) and the 2FoFc map contoured at 1σ around the Asp204 (in blue). Distances between the C1′ of ImmA (left) and the N1′ of DADMe-ImmA (right) and the phosphate groups are shown in Angstroms. Reproduced from ref . Copyright 2006 American Chemical Society.
Figure 85
Figure 85
Marburg virus infections in cynomolgus macaques treated with BCX4430 (ImmA; Tx). Animals (n = 6) in each group were infected with virus on day 0. BCX4430 (15 mg/kg) was given twice a day by i.m. injection starting at 1, 24, or 48 h after exposure to the virus. Vehicle indicates no BCX4430 was given. Reproduced with permission from ref . Copyright 2014 Nature Publishing.
Figure 86
Figure 86
Chemical mechanism for HIV-1 protease. Structures are (1) enzyme–substrate complex, (2) water attack TS, (3) tetrahedral gem-diol intermediate, (4) proline N-protonation TS, (5) protonated amide intermediate, (6) cleavage of scissile C–N bond TS, and (7) enzyme–product complex. For transition structure 2, the r(C–O) bond distance is the distance between the oxygen of the attacking water and the carbonyl carbon of the peptide. For transition structure 4, r(N–H) is the bond distance between the nitrogen on the proline and the proton on the catalytic aspartate and r(H–O) is defined as the bond distance between the oxygen and the proton on the catalytic aspartate. Finally, in transition structure 6, r(C–N) is the bond distance of the scissile bond of the peptide. Reproduced with permission from ref . Copyright 2012 National Academy of Sciences.
Figure 87
Figure 87
Clinically approved inhibitors for HIV-1 protease. Kd values and year of approval are indicated. The transition state center is highlighted. Adapted with permission from ref . Copyright 2017 Elsevier Paris.

Similar articles

Cited by

References

    1. Pauling L Molecular Architecture and Biological Reactions. Chem. Eng. News 1946, 24, 1375–1377.
    1. Pauling L Nature of Forces Between Large Molecules of Biological Interest. Nature 1948, 161, 707–709. - PubMed
    1. Wolfenden R Transition State Analogues for Enzyme Catalysis. Nature 1969, 223, 704–705. - PubMed
    1. Wolfenden R Transition State Analog Inhibitors and Enzyme Catalysis. Annu. Rev. Biophys. Bioeng 1976, 5, 271–306. - PubMed
    1. Wolfenden R Thermodynamic and Extrathermodynamic Requirements of Enzyme Catalysis. Biophys. Chem 2003, 105, 559–572. - PubMed

Publication types