. 2018 Oct 17;7(10):365.
doi: 10.3390/jcm7100365.

AST-120 Reduces Neuroinflammation Induced by Indoxyl Sulfate in Glial Cells

Affiliations

AST-120 Reduces Neuroinflammation Induced by Indoxyl Sulfate in Glial Cells

Simona Adesso et al. J Clin Med. .

Abstract

Chronic kidney disease (CKD) involves multiple organ dysfunction, and the neurological complications that are often present in CKD patients support the idea of a crosstalk between the kidneys and the brain. Evidence suggests a possible role for products accumulating in these patients as uremic toxins in various CKD complications, including neurodegeneration. Indoxyl sulfate (IS), derived from tryptophan metabolism, is well-known as a uremic nephron-vascular toxin, and recent evidence suggests it also has a role in the immune response and in neurodegeneration. Inflammation has been associated with neurodegenerative diseases, as well as with CKD. In this study, we demonstrated that sera of CKD patients induced a significant inflammation in astrocyte cells which was proportional to IS sera concentrations, and that the IS adsorbent, AST-120, reduced this inflammatory response. These results indicated that, among the uremic toxins accumulating in serum of CKD patients, IS significantly contributed to astrocyte inflammation. Moreover, being also chronic inflammation associated with CKD, here we reported that IS further increased inflammation and oxidative stress in primary central nervous system (CNS) cells, via Nuclear Factor-κB (NF-κB) and Aryl hydrocarbon Receptor (AhR) activation, and induced neuron death. This study is a step towards elucidating IS as a potential pharmacological target in CKD patients.

Keywords: AST-120; chronic kidney disease; glial cells; indoxyl sulfate; neuroinflammation.


Conflict of interest statement

Masaki Fujioka is employee of Kureha Corporation (Tokyo, Japan). He had no influence on interpretation of study results and the decision to submit the manuscript for publication. The other authors had no conflict of interest.

Figures

Figure 1
Figure 1
Effect on ROS production in C6 astocytes of sera from eighteen different subjects: four human healthy people (H1–H4; Panel A), eight CKD patients (CKD1–CKD8; Panel B), and six CKD dialysed patients (HD1–HD6; Panel C), also treated with AST-120. In order to highlight the relationship between ROS release and IS serum levels, a linear regression analysis was performed. Linear regression of ROS release by C6 cells treated with sera alone or in the presence of AST-120, indicated F = 52.65, DFn = 1, DFd = 68, p < 0.0001; the difference between the slopes are considered extremely significant (Panel D). The effect of the eighteen tested sera, also treated with AST-120, on ROS production in C6 astrocytes during inflammatory conditions, induced by LPS (1 µg/mL) + IFN (100 U/mL) is shown (Panel E, F, and G). Comparisons were performed using a one-way analysis of variance and multiple comparisons were made by Bonferroni’s test. °°°, °° and ° denote p < 0.001, p < 0.05 vs. control. ***, ** denote p < 0.001, p < 0.01 vs. serum alone. ###,# denote p < 0.001, p < 0.05 vs. LPS + IFN. òò, ò denote p < 0.01, p < 0.05 vs. serum + LPS + IFN.
Figure 1
Figure 1
Effect on ROS production in C6 astocytes of sera from eighteen different subjects: four human healthy people (H1–H4; Panel A), eight CKD patients (CKD1–CKD8; Panel B), and six CKD dialysed patients (HD1–HD6; Panel C), also treated with AST-120. In order to highlight the relationship between ROS release and IS serum levels, a linear regression analysis was performed. Linear regression of ROS release by C6 cells treated with sera alone or in the presence of AST-120, indicated F = 52.65, DFn = 1, DFd = 68, p < 0.0001; the difference between the slopes are considered extremely significant (Panel D). The effect of the eighteen tested sera, also treated with AST-120, on ROS production in C6 astrocytes during inflammatory conditions, induced by LPS (1 µg/mL) + IFN (100 U/mL) is shown (Panel E, F, and G). Comparisons were performed using a one-way analysis of variance and multiple comparisons were made by Bonferroni’s test. °°°, °° and ° denote p < 0.001, p < 0.05 vs. control. ***, ** denote p < 0.001, p < 0.01 vs. serum alone. ###,# denote p < 0.001, p < 0.05 vs. LPS + IFN. òò, ò denote p < 0.01, p < 0.05 vs. serum + LPS + IFN.
Figure 2
Figure 2
Effect of sera from eighteen different subjects: four healthy people (H1–H4; Panel A and D), eight CKD patients (CKD1–CKD8; Panel B and E) and six CKD dialysed patients (HD1–HD6; Panel C and F), with or without AST-120, on nitrite (Panel AC) and on TNF-α (Panel DF) production in inflammatory conditions, induced by LPS (1 µg/mL) and IFN (100 U/mL) in C6 cells. Values are expressed as [µM] NO2 release, or as pg/mL protein, respectively. Comparisons were performed using a one-way analysis of variance and multiple comparisons were made by Bonferroni’s test. °°° denotes p < 0.001 vs. control. ###, ##, # denote p < 0.001, p < 0.01, p < 0.05 vs. LPS + IFN. Òòò, òò, ò denote p < 0.001, p < 0.01, p < 0.05 vs. serum + LPS + IFN.
Figure 2
Figure 2
Effect of sera from eighteen different subjects: four healthy people (H1–H4; Panel A and D), eight CKD patients (CKD1–CKD8; Panel B and E) and six CKD dialysed patients (HD1–HD6; Panel C and F), with or without AST-120, on nitrite (Panel AC) and on TNF-α (Panel DF) production in inflammatory conditions, induced by LPS (1 µg/mL) and IFN (100 U/mL) in C6 cells. Values are expressed as [µM] NO2 release, or as pg/mL protein, respectively. Comparisons were performed using a one-way analysis of variance and multiple comparisons were made by Bonferroni’s test. °°° denotes p < 0.001 vs. control. ###, ##, # denote p < 0.001, p < 0.01, p < 0.05 vs. LPS + IFN. Òòò, òò, ò denote p < 0.001, p < 0.01, p < 0.05 vs. serum + LPS + IFN.
Figure 3
Figure 3
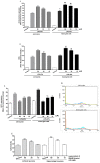
Effect of IS (60, 30 and 15 μM) in inflammatory conditions, induced by LPS (1 µg/mL) + IFN (100 U/mL), on NO relase (Panel A), evaluated as NO2 [µM]. Effect of IS (15–60 μM) in presence of LPS (1 µg/mL) + IFN (100 U/mL) on iNOS (Panel B), and COX-2 (Panel D) expression in primary astrocytes and mixed glial cells. Cellular fluorescence was evaluated using fluorescence-activated cell sorting analysis (FACSscan; Becton Dickinson), and elaborated with Cell Quest software. Panel C shows the representative fluorescence images for iNOS expression (for primary astrocytes the pink line represent the cellular control, the blue line represent LPS + IFN, the yellow line represent IS 30 µM + LPS + IFN; for mixed glial cells the violet line represent the cellular control, the light blue line represent LPS + IFN, the orange line represent IS 30 µM + LPS + IFN). Panel E shows the representative fluorescence images for COX-2 expression (for primary astrocytes the pink line represent the cellular control, the blue line represent LPS + IFN, the yellow line represent IS 30 µM with LPS + IFN; for mixed glial cells the violet line represent the cellular control, the light blue line represent LPS + IFN, the orange line represent IS 30 µM with LPS + IFN. Effect of IS (15, 30, and 60 μM) in inflammatory conditions, induced by LPS (1 µg/mL) and IFN (100 U/mL) on TNF-α (Panel F) and on IL-6 (Panel G) release by astrocytes and mixed glial cells. Cyokine release was assessed by ELISA assay. Values are expressed as NO2- release, or mean fluorescence intensity or as pg/mL protein for cytokines. Comparisons were performed using a one-way analysis of variance and multiple comparisons were made by Bonferroni’s post test. °°° denotes p < 0.001 vs. control. ***, ** denote p < 0.001 and p < 0.01 vs. LPS + IFN. òòò, òò, ò denote p < 0.001, p < 0.01 and p < 005 vs. astrocytes treated with LPS + IFN. ###, # denote p < 0.001 and p < 0.05 vs. astrocytes treated with IS andLPS + IFN.
Figure 3
Figure 3
Effect of IS (60, 30 and 15 μM) in inflammatory conditions, induced by LPS (1 µg/mL) + IFN (100 U/mL), on NO relase (Panel A), evaluated as NO2 [µM]. Effect of IS (15–60 μM) in presence of LPS (1 µg/mL) + IFN (100 U/mL) on iNOS (Panel B), and COX-2 (Panel D) expression in primary astrocytes and mixed glial cells. Cellular fluorescence was evaluated using fluorescence-activated cell sorting analysis (FACSscan; Becton Dickinson), and elaborated with Cell Quest software. Panel C shows the representative fluorescence images for iNOS expression (for primary astrocytes the pink line represent the cellular control, the blue line represent LPS + IFN, the yellow line represent IS 30 µM + LPS + IFN; for mixed glial cells the violet line represent the cellular control, the light blue line represent LPS + IFN, the orange line represent IS 30 µM + LPS + IFN). Panel E shows the representative fluorescence images for COX-2 expression (for primary astrocytes the pink line represent the cellular control, the blue line represent LPS + IFN, the yellow line represent IS 30 µM with LPS + IFN; for mixed glial cells the violet line represent the cellular control, the light blue line represent LPS + IFN, the orange line represent IS 30 µM with LPS + IFN. Effect of IS (15, 30, and 60 μM) in inflammatory conditions, induced by LPS (1 µg/mL) and IFN (100 U/mL) on TNF-α (Panel F) and on IL-6 (Panel G) release by astrocytes and mixed glial cells. Cyokine release was assessed by ELISA assay. Values are expressed as NO2- release, or mean fluorescence intensity or as pg/mL protein for cytokines. Comparisons were performed using a one-way analysis of variance and multiple comparisons were made by Bonferroni’s post test. °°° denotes p < 0.001 vs. control. ***, ** denote p < 0.001 and p < 0.01 vs. LPS + IFN. òòò, òò, ò denote p < 0.001, p < 0.01 and p < 005 vs. astrocytes treated with LPS + IFN. ###, # denote p < 0.001 and p < 0.05 vs. astrocytes treated with IS andLPS + IFN.
Figure 4
Figure 4
Effect of IS (60, 30 and 15 μM) on primary CNS cells treated with LPS (1 µg/mL) + IFN (100 U/mL) on nitrotyrosine formation (Panel A), and on ROS release (Panel B), evaluated by means of the probe 2’,7’ dichlorofluorescein-diacetate (H2DCF-DA) and on HO-1 expression (Panel C) in prmary astrocytes and mixed glial cells. Cellular fluorescence was evaluated using fluorescence-activated cell sorting analysis (FACSscan; Becton Dickinson) and elaborated with Cell Quest software. Panel D shows the representative fluorescence images for HO-1 expression (for primary astrocytes the pink line represent the cellular control, the blue line represent LPS + IFN, the yellow line represent IS 30 µM in presence of LPS + IFN; for mixed glial cells the violet line represent the cellular control, the light blue line represent LPS + IFN, the orange line represent IS 30 µM + LPS + IFN). Panel E shows the effect of supernatant from IS-treated microglia on cortical and hippocampal neuronal cell viability. Values are expressed as mean fluorescence intensity or as cell citotoxicity. Comparisons were performed using a one-way analysis of variance and multiple comparisons were made by Bonferroni’s post test. °°°, °° denote p < 0.001 and p < 0.01 vs. control. ***, ** denote p < 0.001 and p < 0.01 vs. LPS + IFN. òò denotes p < 0.01 vs. astrocytes treated with LPS + IFN. ## denotes p < 0.01 vs. astrocytes treated with IS + LPS + IFN.
Figure 5
Figure 5
Effect of IS (30 μM) on p65 (Panel A) and on AhR (Panel B) nuclear translocation in astrocytes and mixed glial cells in inflammatory conditions, induced by LPS (1 µg/mL) + IFN (100 U/mL). Nuclear translocation of p65 and AhR was detected using immunofluorescence confocal microscopy. The scale bar was 10 µm. Blue fluorescence indicated the localization of the nucleus (DAPI) and green indicated the localization of p65 or AhR.

References

    1. Yuan J., Yankner B.A. Apoptosis in the nervous system. Nature. 2000;407:802–809. doi: 10.1038/35037739. - DOI - PubMed
    1. Przedborski S., Vila M., Jackson-Lewis V. Neurodegeneration: What is it and where are we? J. Clin. Investig. 2003;111:3–10. doi: 10.1172/JCI200317522. - DOI - PMC - PubMed
    1. Hsieh H.L., Yang C.M. Role of redox signaling in neuroinflammation and neurodegenerative diseases. BioMed Res. Int. 2013;2013:484613. doi: 10.1155/2013/484613. - DOI - PMC - PubMed
    1. Krishnan A.V., Kiernan M.C. Neurological complications of chronic kidney disease. Nat. Rev. Neurol. 2009;5:542–551. doi: 10.1038/nrneurol.2009.138. - DOI - PubMed
    1. Buchman A.S., Tanne D., Boyle P.A., Shah R.C., Leurgans S.E., Bennett D.A. Kidney function is associated with the rate of cognitive decline in the elderly. Neurology. 2009;73:920–927. doi: 10.1212/WNL.0b013e3181b72629. - DOI - PMC - PubMed

LinkOut - more resources