Prediction of Target Genes and Pathways Associated With Cetuximab Insensitivity in Colorectal Cancer
- PMID: 30336768
- PMCID: PMC6196627
- DOI: 10.1177/1533033818806905
Prediction of Target Genes and Pathways Associated With Cetuximab Insensitivity in Colorectal Cancer
Abstract
Background: Cetuximab has been regularly added to the treatments for metastatic colorectal cancer worldwide. However, due to its therapeutic insensitivity and underlying mechanisms being largely unknown, the clinical implementation of cetuximab in colorectal cancer remains limited.
Methods: The gene expression profile GSE56386 was retrieved from the Gene Expression Omnibus database. Differentially expressed genes were identified between cetuximab-responsive patients and nonresponders, annotated by gene ontology, Kyoto Encyclopedia of Genes and Genomes pathway analysis, and further analyzed by protein-protein interaction networks. The integrative prognostic analysis was based on The Cancer Genome Atlas and PrognoScan.
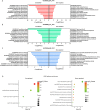
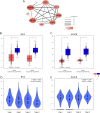
Results: 1350 differentially expressed genes were identified with 298 upregulated and 1052 downregulated. Epidermis development, the cornified envelope, calcium ion binding, and amoebiasis were enriched in upregulated genes while digestion, the apical part of the cell, the 3',5'-cyclic-adenosine monophosphate phosphodiesterase activity and pancreatic secretion were found enriched in downregulated genes. The top 10 hub genes were identified, including epithermal growth factor, G-protein subunit β 5, G-protein subunit γ 4, fibroblast growth factor 2, B-cell lymphoma protein 2, acetyl-coenzyme A carboxylase β, KIT proto-oncogene receptor tyrosine kinase, adenylate cyclase 4, neuropeptide Y, and neurotensin. The hub genes exhibited distinct correlations in cetuximab-treated and untreated genomic profiles (GSE56386, GSE5851 and GSE82236). The highest correlation was found between B-cell lymphoma protein 2 and acetyl-coenzyme A carboxylase β in GSE56386. The mRNA expression of hub genes was further validated in the genomic profile GSE65021. Furthermore, B-cell lymphoma protein 2 and acetyl-coenzyme A carboxylase β also exhibited highest degrees among the hub genes correlation networks based on The Cancer Genome Atlas. Both B-cell lymphoma and acetyl-coenzyme A carboxylase β were not independent prognostic factors for colorectal cancer in univariate and multivariate Cox analysis. However, integrative survival analysis indicated that B-cell lymphoma protein 2 was associated with favorable prognosis (hazard ratio = 0.62, 95% confidence interval, 0.30-0.95, P = .024).
Discussion: This in silico analysis provided a feasible and reliable strategy for systematic exploration of insightful target genes, pathways and mechanisms underlying the cetuximab insensitivity in colorectal cancer. B-cell lymphoma protein 2 was associated with favorable prognosis.
Keywords: KEGG pathway; cetuximab; colorectal cancer; differentially expressed genes; gene ontology; protein–protein interaction.
Conflict of interest statement
Figures


Similar articles
-
Bioinformatics analyses of significant genes, related pathways and candidate prognostic biomarkers in glioblastoma.Mol Med Rep. 2018 Nov;18(5):4185-4196. doi: 10.3892/mmr.2018.9411. Epub 2018 Aug 21. Mol Med Rep. 2018. PMID: 30132538 Free PMC article.
-
Identification of a five-gene signature with prognostic value in colorectal cancer.J Cell Physiol. 2019 Apr;234(4):3829-3836. doi: 10.1002/jcp.27154. Epub 2018 Aug 21. J Cell Physiol. 2019. PMID: 30132881
-
Identification of Critical Genes and Five Prognostic Biomarkers Associated with Colorectal Cancer.Med Sci Monit. 2018 Jul 5;24:4625-4633. doi: 10.12659/MSM.907224. Med Sci Monit. 2018. PMID: 29973580 Free PMC article.
-
Transcriptomic Signatures in Colorectal Cancer Progression.Curr Mol Med. 2023;23(3):239-249. doi: 10.2174/1566524022666220427102048. Curr Mol Med. 2023. PMID: 35490318 Review.
-
Integration of genetic variants and gene network for drug repurposing in colorectal cancer.Pharmacol Res. 2020 Nov;161:105203. doi: 10.1016/j.phrs.2020.105203. Epub 2020 Sep 17. Pharmacol Res. 2020. PMID: 32950641
Cited by
-
Antitumor Effect of Poplar Propolis on Human Cutaneous Squamous Cell Carcinoma A431 Cells.Int J Mol Sci. 2023 Nov 25;24(23):16753. doi: 10.3390/ijms242316753. Int J Mol Sci. 2023. PMID: 38069077 Free PMC article.
-
Targeting Adenylate Cyclase Family: New Concept of Targeted Cancer Therapy.Front Oncol. 2022 Jun 27;12:829212. doi: 10.3389/fonc.2022.829212. eCollection 2022. Front Oncol. 2022. PMID: 35832555 Free PMC article. Review.
-
Predicting Panel of Metabolism and Immune-Related Genes for the Prognosis of Human Ovarian Cancer.Front Cell Dev Biol. 2021 Jul 12;9:690542. doi: 10.3389/fcell.2021.690542. eCollection 2021. Front Cell Dev Biol. 2021. PMID: 34322485 Free PMC article.
-
ACACB is a novel metabolism-related biomarker in the prediction of response to cetuximab therapy inmetastatic colorectal cancer.Acta Biochim Biophys Sin (Shanghai). 2022 Sep 25;54(11):1671-1683. doi: 10.3724/abbs.2022121. Acta Biochim Biophys Sin (Shanghai). 2022. PMID: 36111743 Free PMC article.
-
Association between liver targeted antiviral therapy in colorectal cancer and survival benefits: An appraisal.World J Clin Cases. 2020 Jun 6;8(11):2111-2115. doi: 10.12998/wjcc.v8.i11.2111. World J Clin Cases. 2020. PMID: 32548140 Free PMC article. Review.
References
-
- Chen W, Zheng R, Baade PD, et al. Cancer statistics in China, 2015. CA Cancer J Clin. 2016;66(2):115–132. - PubMed
-
- Jonker DJ, O’Callaghan CJ, Karapetis CS, et al. Cetuximab for the treatment of colorectal cancer. N Eng J Med. 2007;357(20):2040–2048. - PubMed
-
- Siegel RL, Miller KD, Fedewa SA, et al. Colorectal cancer statistics, 2017. CA Cancer J Clin. 2017;67(3):177–193. - PubMed
-
- Cassidy J, Twelves C, Van Cutsem E, et al. First-line oral capecitabine therapy in metastatic colorectal cancer: a favorable safety profile compared with intravenous 5-fluorouracil/leucovorin. Ann Oncol. 2002;13(4):566–575. - PubMed
-
- Goldberg RM, Sargent DJ, Morton RF, et al. A randomized controlled trial of fluorouracil plus leucovorin, irinotecan, and oxaliplatin combinations in patients with previously untreated metastatic colorectal cancer. J Clin Oncol. 2004;22(1):23–30. - PubMed
Publication types
MeSH terms
Substances
LinkOut - more resources
Full Text Sources
Medical

