. 2018 Oct 19;362(6412):339-343.
doi: 10.1126/science.aau3301.

Supracellular contraction at the rear of neural crest cell groups drives collective chemotaxis

Affiliations

Supracellular contraction at the rear of neural crest cell groups drives collective chemotaxis

Adam Shellard et al. Science. .

Abstract

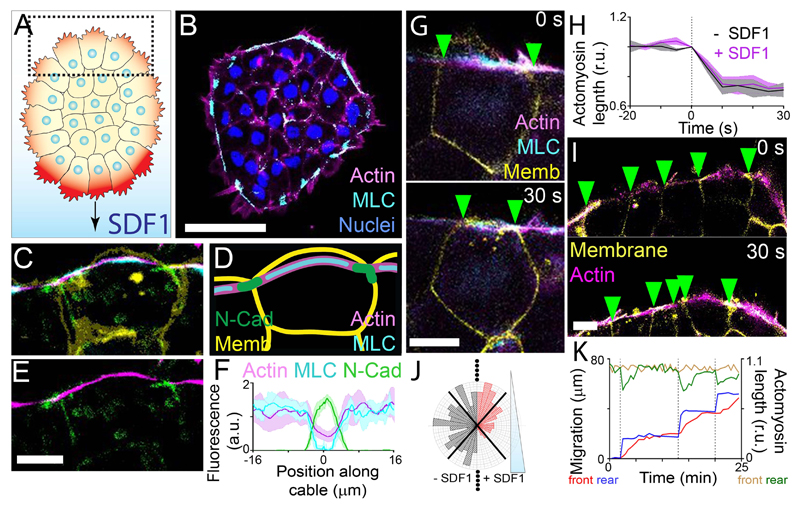
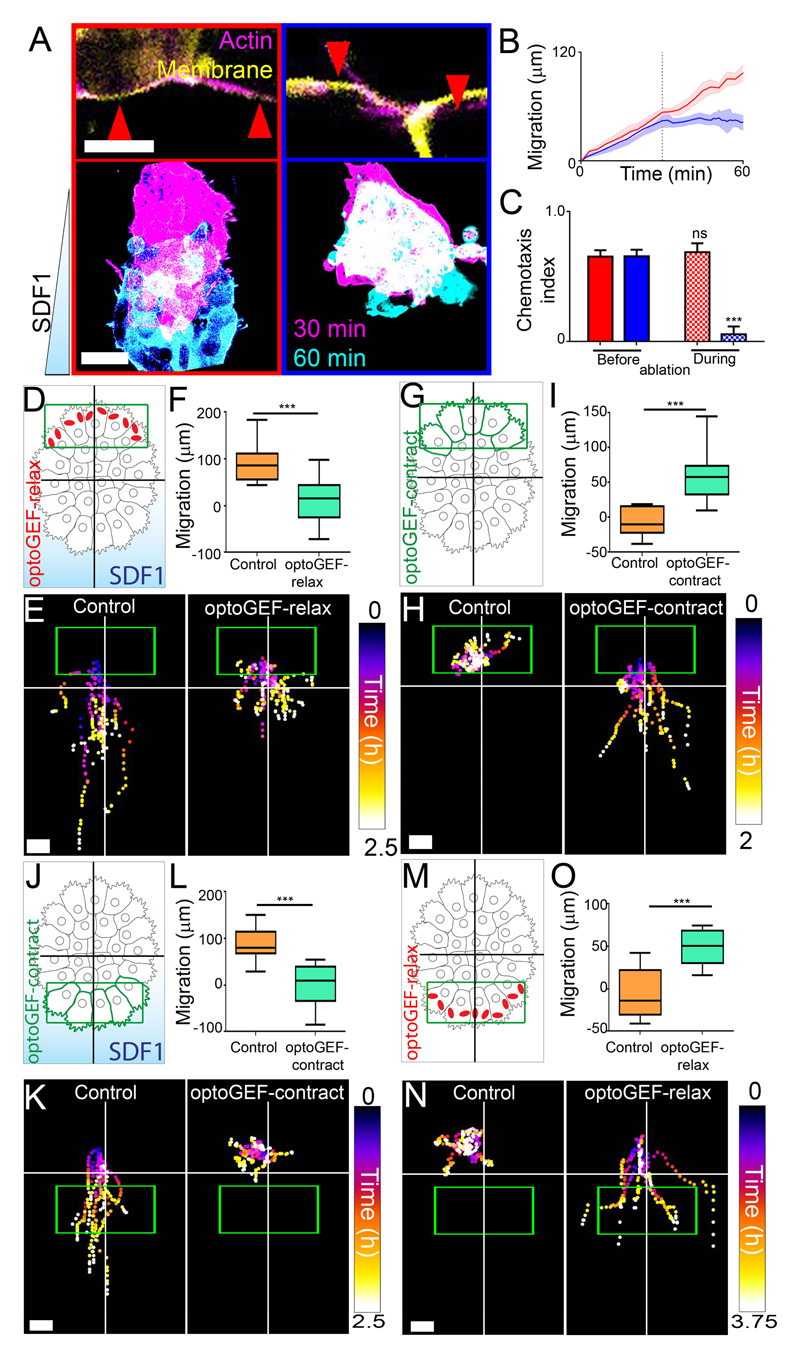
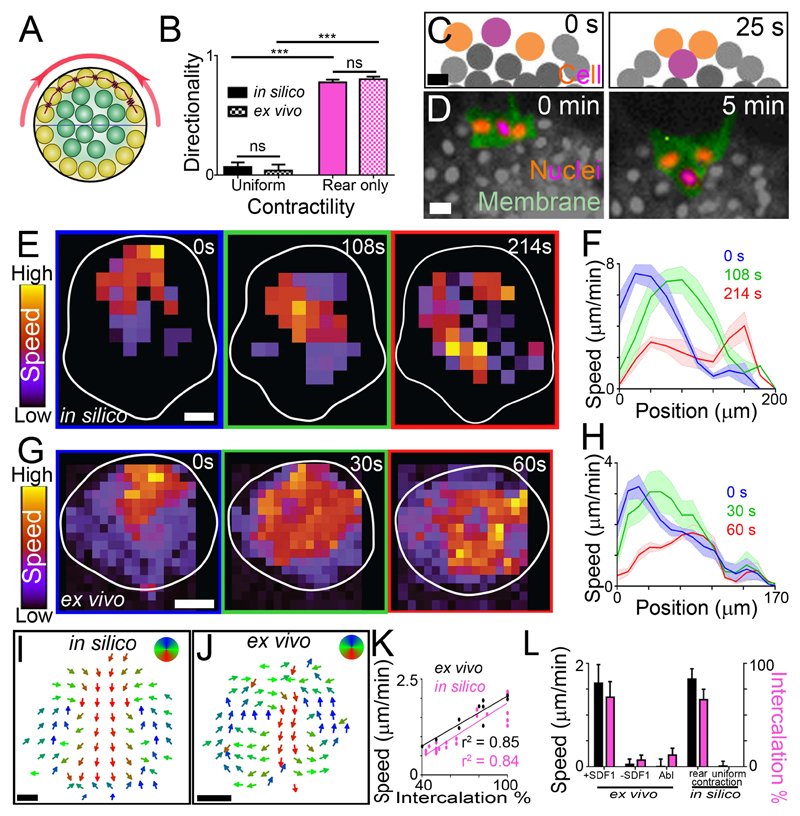
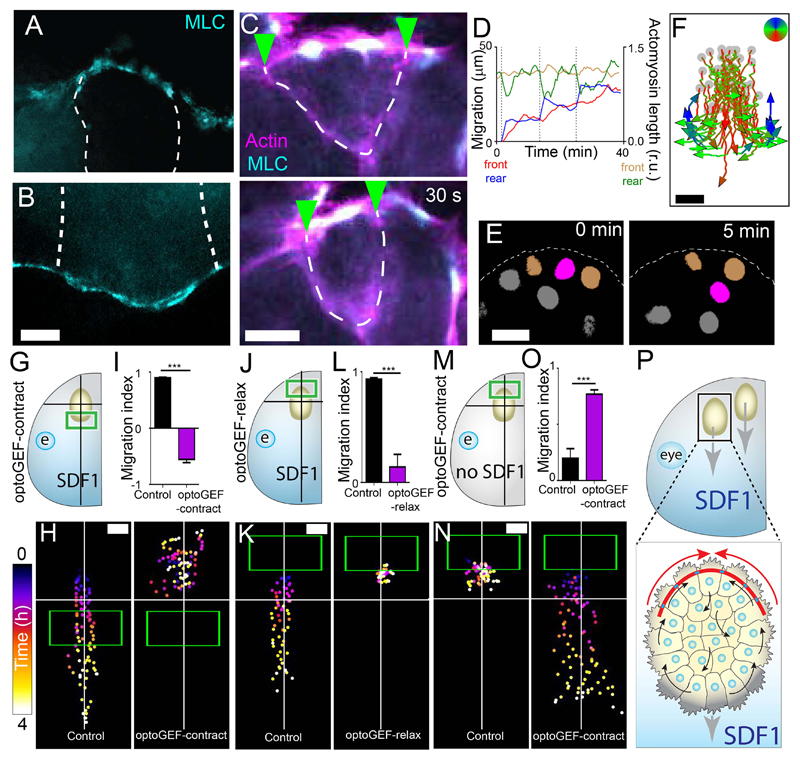
Collective cell chemotaxis, the directed migration of cell groups along gradients of soluble chemical cues, underlies various developmental and pathological processes. We use neural crest cells, a migratory embryonic stem cell population whose behavior has been likened to malignant invasion, to study collective chemotaxis in vivo. Studying Xenopus and zebrafish, we have shown that the neural crest exhibits a tensile actomyosin ring at the edge of the migratory cell group that contracts in a supracellular fashion. This contractility is polarized during collective cell chemotaxis: It is inhibited at the front but persists at the rear of the cell cluster. The differential contractility drives directed collective cell migration ex vivo and in vivo through the intercalation of rear cells. Thus, in neural crest cells, collective chemotaxis works by rear-wheel drive.


Conflict of interest statement

Competing interests: Authors declare no competing interests.

Figures

Fig. 1
Fig. 1. Xenopus neural crest clusters exhibit a contractile actomyosin ring.
(A) Neural crest with protrusions (red) at the edge undergoes chemotaxis to SDF1. SDF1 stabilizes the protrusions at the front (darker red) (7). Dotted square: rear cells. (B) Immunofluorescence of a neural crest explant in the absence of SDF1. MLC: myosin light chain. Scale bar, 50 μm. (C to E) Immunofluorescence of a cell at the edge of a neural crest explant (C and E) and diagram (D). Memb: membrane. Scale bar, 10 μm. (F) Protein fluorescence levels (means ± SEM) along the actin cable. Position 0 μm represents the cell contact. n = 8 cells. (G) Spontaneous contraction of the actomyosin cable. Green arrowheads: cell-cell contacts. Scale bar, 10 μm. (H) Actomyosin length (means ± SEM) measured over time. Contractions start at 0 s. n = 20 cells. (I) Multicellular contraction of the actomyosin cable. Scale bar, 10 μm. (J) Distribution of actomyosin contractility at different angles without (-SDF1) or with (+SDF1) an SDF1 gradient. n = 150 contractions. (K) Relative actomyosin length at the front (brown line) and rear (green line) of a cluster, and the position of the front (red line) and rear (blue line) of the cluster.
Fig. 2
Fig. 2. Rear contractility is necessary and sufficient for collective chemotaxis of Xenopus neural crest.
(A) Above, examples of two neighboring cells with ablations (red arrowheads). Scale bar, 10 μm. Below, images of explants exposed to SDF1 gradients during ablations between the indicated times. For A to C, red: front actomyosin cable ablation; blue: rear actomyosin cable ablation. Scale bar, 50 μm. (B) Position of the front of explants during chemotaxis (means ± SEM); dashed line indicates when ablations begin. n = 6-8 clusters. (C) Chemotaxis index (means ± SEM) of clusters. n = 6-8 clusters. ***P ≤ 0.001 (two-tailed Student’s t-test); ns, not significant. (D to O) Experimental setup for treated explants (D, G, J and M), representative cluster tracks (E, H, K and N) and the distance migrated (means ± SEM) over times as indicated in Methods (F, I, L and O). n = 10-23 clusters (F), n = 10-11 clusters (I), n = 14-18 clusters (L), n = 11-12 clusters (O). ***P ≤ 0.001 (two-tailed Student’s t-test). Scale bar, 40 μm (E and K); 20 μm (H and N). Green box: initial illumination area; cross: initial cluster position. Top of all pictures is the rear.
Fig. 3
Fig. 3. Modelling contractility-driven collective migration.
(A) Illustration of the computational model cluster. Yellow: edge cells; green: internal cells; red: contraction; horizontal line: distinction between front and rear, with rear outer cells contracting (red spring). (B) Directionality (means ± SEM) of clusters. n = 10 clusters. ***P ≤ 0.001 (two-tailed Student’s t-test); ns, not significant. (C and D) Intercalation of a rear cell (purple) between two adjacent cells (orange) in silico (C) and ex vivo (D) during directional migration. Scale bar, 20 μm. (E to H) Wave of contraction. Speed heat map during migration in silico (E) and ex vivo (G). Speed profile (means ± SEM) from clusters in silico (F) and ex vivo (H) at different times during directional migration. Position 0 μm represents the rear of the cluster; position 200 μm and 170 μm (F and H, respectively) represents the front of the cluster. n = 5 clusters. Scale bar, 40 μm. (I and J) Direction of intra-cluster cell movements shown from time-averaged cell tracks in silico (I) and PIV ex vivo (J) after subtracting cluster movement. n = 5 clusters. Scale bar, 40 μm. (K) Cluster speed and rear cell intercalation during migration. (L) Cluster speed (means ± SEM) and rear cell intercalation (means ± SEM) of clusters. Abl: laser ablation of the actomyosin ring in rear cells. n = 6-21 clusters. ***P ≤ 0.001 (two-tailed Student’s t-test); ns, not significant. Top of all pictures is the rear.
Fig. 4
Fig. 4. Actomyosin drives collective chemotaxis in vivo in Xenopus.
(A and B) Immunofluorescence of the rear (A) and front (B) of the Xenopus neural crest stream. MLC: myosin light chain; dashed lines: cell-cell contacts between neural crest cells. Scale bar, 10 μm. (C) Contraction of the actomyosin cable of Xenopus neural crest in vivo; green arrowheads: cell-cell contacts; dashed line: cell edges. Scale bar, 10 μm. (D) Actomyosin length at the front (brown line) and rear (green line) of a Xenopus cluster in vivo, and the position of the front (red line) and rear (blue line) of the cluster. (E) Intercalation of a rear cell (purple) between two adjacent cells (orange) in in vivo. Scale bar, 20 μm. (F) Tracks of rear neural crest cells in vivo after subtracting the cluster movement. Scale bar, 30 μm. Grey dots: initial cell positions. (G to N) Experimental design of treated Xenopus embryos (G, J and M), representative tracks of neural crest clusters (H, K and N) and migration index (means ± SEM) (I, L and O). Green box: initial illumination area; cross: starting position of the explant. n = 10 clusters. ***P ≤ 0.001 (two-tailed Student’s t-test). Scale bar, 50 μm. (P) The model: collective cell chemotaxis is driven by actomyosin contractility at the rear (red arrows). Top of all pictures is the rear.

Comment in

References

    1. Friedl P, Gilmour D. Collective cell migration in morphogenesis, regeneration and cancer. Nature Reviews Molecular Cell Biology. 2009;10:445–457. - PubMed
    1. Roca-Cusachs P, Sunyer R, Trepat X. Mechanical guidance of cell migration: lessons from chemotaxis. Current Opinion in Cell Biology. 2013;25:543–549. - PubMed
    1. Mayor R, Etienne-Manneville S. The front and rear of collective cell migration. Nature Reviews Molecular Cell Biology. 2016;17:97–109. - PubMed
    1. Haeger A, Wolf K, Zegers MM, Friedl P. Collective cell migration: guidance principles and hierarchies. Trends in Cell Biology. 2015;25:556–566. - PubMed
    1. Majumdar R, Sixt M, Parent CA. New paradigms in the establishment and maintenance of gradients during directed cell migration. Current Opinion in Cell Biology. 2014;30:33–40. - PMC - PubMed

Publication types