. 2018 Nov 23;362(6417):911-917.
doi: 10.1126/science.aau3879. Epub 2018 Oct 18.

Somatic mutant clones colonize the human esophagus with age

Affiliations

Somatic mutant clones colonize the human esophagus with age

Iñigo Martincorena et al. Science. .

Abstract

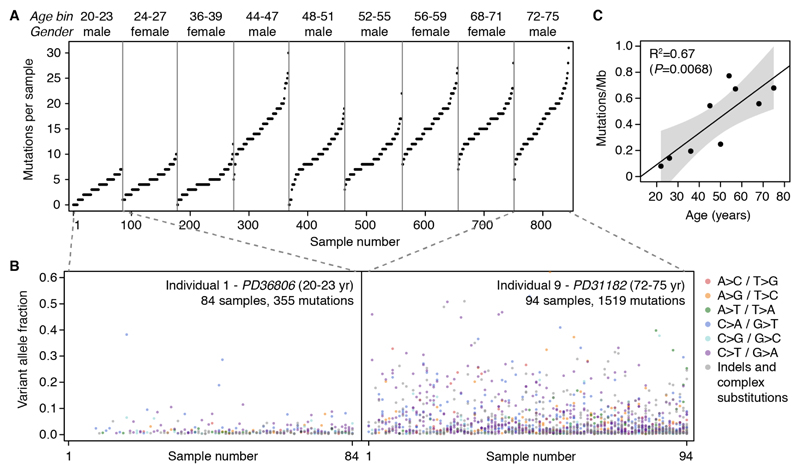
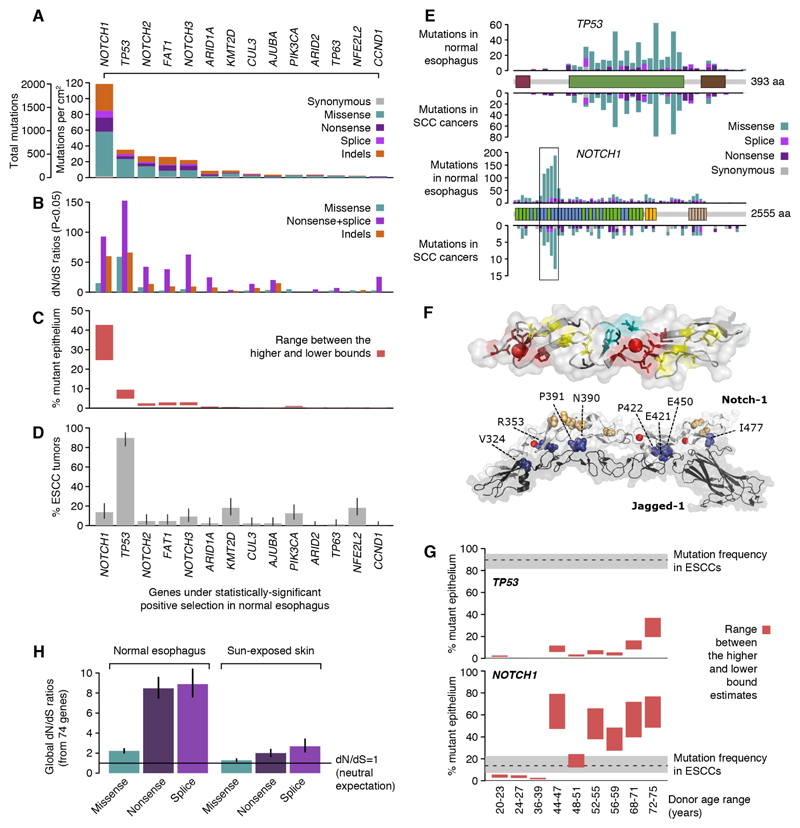
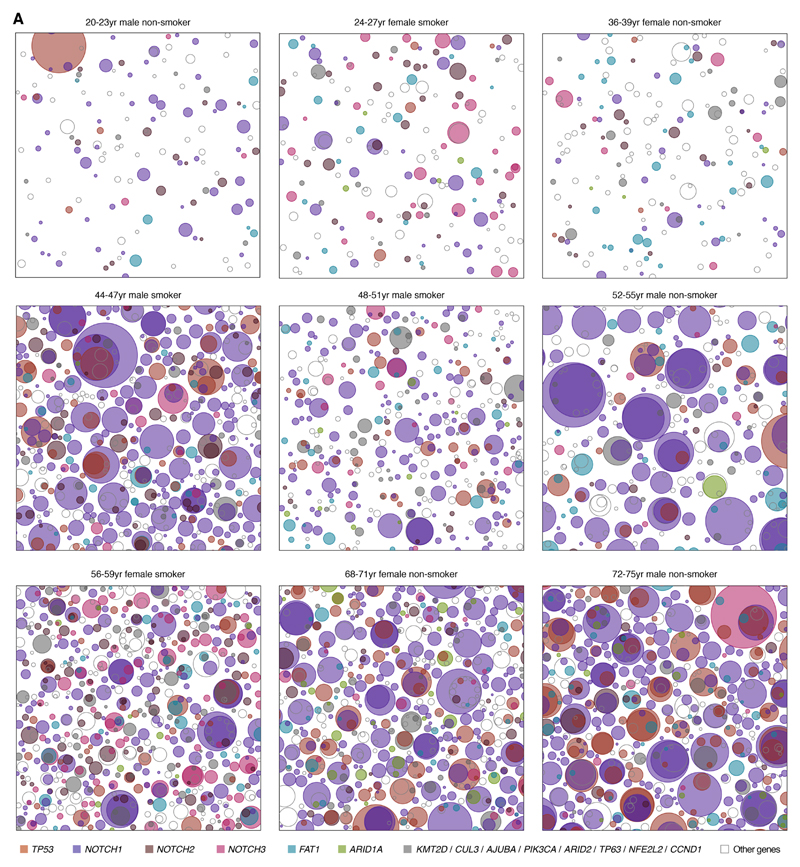
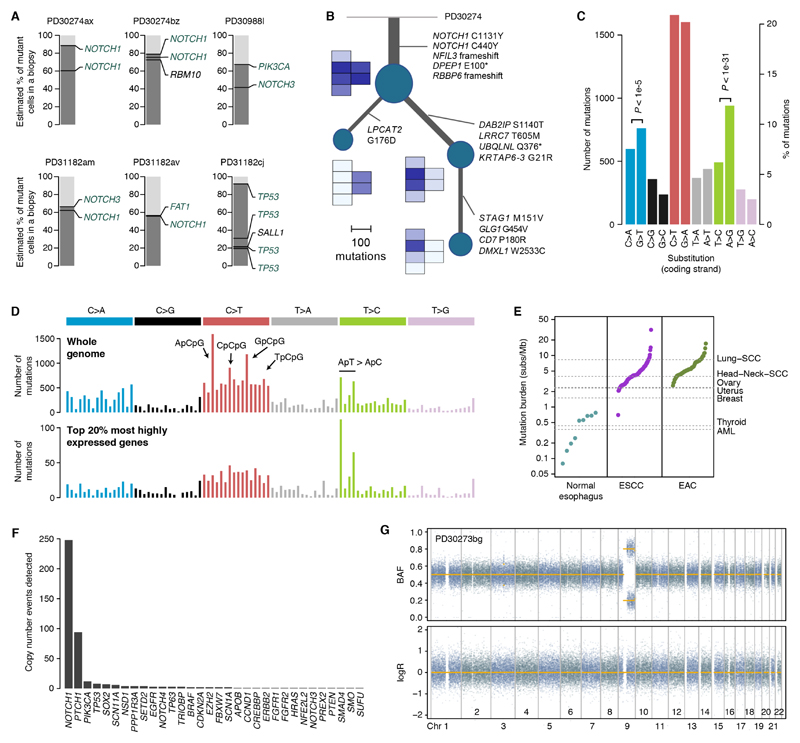
The extent to which cells in normal tissues accumulate mutations throughout life is poorly understood. Some mutant cells expand into clones that can be detected by genome sequencing. We mapped mutant clones in normal esophageal epithelium from nine donors (age range, 20 to 75 years). Somatic mutations accumulated with age and were caused mainly by intrinsic mutational processes. We found strong positive selection of clones carrying mutations in 14 cancer genes, with tens to hundreds of clones per square centimeter. In middle-aged and elderly donors, clones with cancer-associated mutations covered much of the epithelium, with NOTCH1 and TP53 mutations affecting 12 to 80% and 2 to 37% of cells, respectively. Unexpectedly, the prevalence of NOTCH1 mutations in normal esophagus was several times higher than in esophageal cancers. These findings have implications for our understanding of cancer and aging.


Conflict of interest statement

Competing interests: M.R.S. is on the Scientific Advisory Board of GRAIL. The other authors declare no competing interests.

Figures

Fig. 1
Fig. 1. Detection of somatic mutations in normal esophagus.
(A) Number of mutations detected per sample across the 844 samples from the 9 transplant donors (sorted by age). Donor age is shown as 4-year bins to increase sample anonymity. (B) Variant allele fraction (VAF) of the mutations detected in the youngest and oldest donor, colored by mutation type. The VAF is the fraction of sequencing reads reporting a mutation within a sample. (C) Scatter plot of donor age and the estimated mean mutation burden per cell for each donor. The fitted line, R-square value and P-value were obtained by linear regression.
Fig. 2
Fig. 2. Widespread positive selection of cancer-associated mutations in normal esophagus.
(A) Number of mutations detected in each of the 14 genes found under positive selection. (B) Observed-to-expected ratios for missense substitutions, truncating (nonsense and essential splice site) substitutions and indels. Observed-to-expected ratios for substitutions are dN/dS ratios. Only ratios with P<0.05 are shown. (C) Estimated percentage of cells carrying a mutation in each gene (Methods S5.3). (D) Percentage of ESCCs with a non-synonymous substitution or an indel in each gene. Error bars depict 95% Poisson confidence intervals. (E) Distribution of mutations within TP53 and NOTCH1 in normal esophagus (above the gene domains diagram) and in SCC cancers from TCGA (below). EGF8-12 region is boxed. (F) Consequences of NOTCH1 missense mutations. (Top panel) Most affect structural residues in EGF domains (shown in stick form, PDB 2VJ3): calcium-binding consensus residues (red), hydrophobic interdomain packing residues (teal), cysteine residues which form disulphide bonds (yellow), conserved glycines (black). Calcium ions shown as red spheres. (Bottom panel) Other residues affected by missense mutations (≥4 per residue) in the EGF8-12 region are shown in space filling representation. Many are predicted to disrupt the Notch receptor/ligand binding interface (shown in deep blue and labelled with residue number), while others are distal (colored wheat) (PDB 5UK5). (G) Estimated percentage of mutant epithelium per donor compared to ESCC mutation frequency. (H) dN/dS values estimated from all 74 target genes together in normal esophagus and sun-exposed skin (7).
Fig. 3
Fig. 3. Variation of the mutational landscape across the 9 donors.
Representative patchwork plots from each donor. Each panel is a schematic representation of the mutant clones in an average 1 cm2 of normal esophageal epithelium from each donor. To generate each figure, a number of samples from the donor are randomly selected to amount to 1 cm2 of tissue and all clones detected are represented as circles randomly distributed in space. The density and size of the clones are inferred from the sequencing data and the nesting of clones and subclones is inferred from the data when possible and randomly allocated otherwise (Methods S5.4).
Fig. 4
Fig. 4. Phylogenetic and mutational patterns in normal esophagus.
(A) Representation of mutations co-occurring in the same clones using the pigeonhole principle (see Supplementary material 5.5). (B) Phylogenetic reconstruction of the evolution of a large clone overlapping six samples using whole-genome sequencing data and spatial information. A small heatmap of the six affected samples is shown next to each node in the tree, depicting the mean VAF of the mutations in each node. (C) Number of substitutions per mutation type as mapped to the coding (untranscribed) strand from all donors. P-values reflect transcription strand asymmetry (exact Poisson test). (D) 96-mutation-class barplot depicting the number of mutations in each of the possible 96 trinucleotides (strand independent). The top panel shows the whole-genome plot aggregating all 21 whole-genomes. The bottom panel shows the spectrum for mutations occurring in the transcribed region of the top 20% most highly expressed genes. (E) Mutation burden in normal esophagus and in ESCC and EAC tumors (every point corresponds to a donor, sorted by mutation burden). (F) Number of copy number events detected in each gene across the 844 samples using the targeted data. (G) Representative LogR and B-allele frequency (BAF) scatter plots for heterozygous SNPs from whole genome data showing a copy-neutral LOH event affecting NOTCH1 (sample PD30273bg shown).

Comment in

Similar articles

Cited by

References

    1. Stratton MR, Campbell PJ, Futreal PA. The cancer genome. Nature. 2009;458:719–724. - PMC - PubMed
    1. Vogelstein B, et al. Cancer genome landscapes. Science (New York, N.Y.) 2013;339:1546–1558. - PMC - PubMed
    1. Merlo LM, Pepper JW, Reid BJ, Maley CC. Cancer as an evolutionary and ecological process. Nature reviews. Cancer. 2006;6:924–935. - PubMed
    1. Martincorena I, et al. Universal Patterns of Selection in Cancer and Somatic Tissues. Cell. 2017;171:1029–1041.e1021. - PMC - PubMed
    1. Anglesio MS, et al. Cancer-Associated Mutations in Endometriosis without Cancer. The New England journal of medicine. 2017;376:1835–1848. - PMC - PubMed

Publication types