. 2018 Oct 18;9(1):4335.
doi: 10.1038/s41467-018-06574-7.

A discrete organoplatinum(II) metallacage as a multimodality theranostic platform for cancer photochemotherapy

Affiliations

A discrete organoplatinum(II) metallacage as a multimodality theranostic platform for cancer photochemotherapy

Guocan Yu et al. Nat Commun. .

Abstract

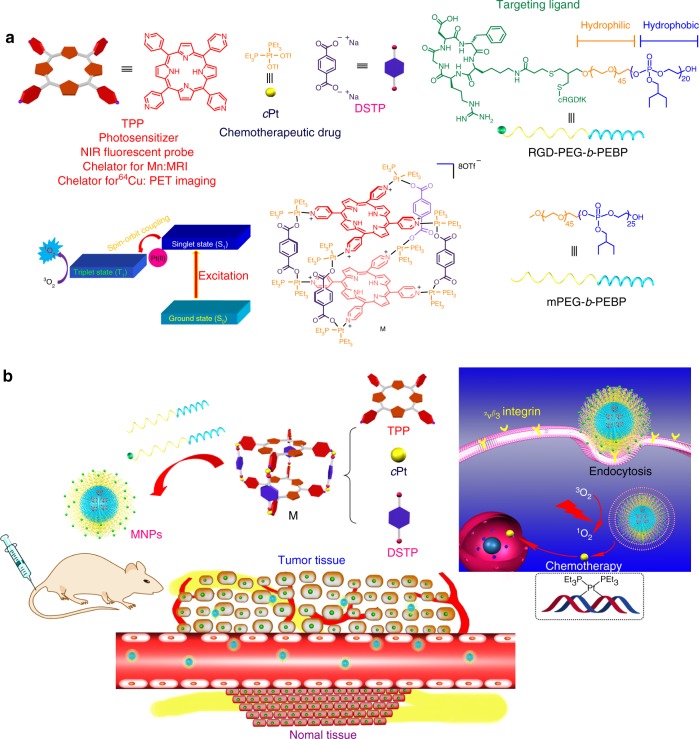
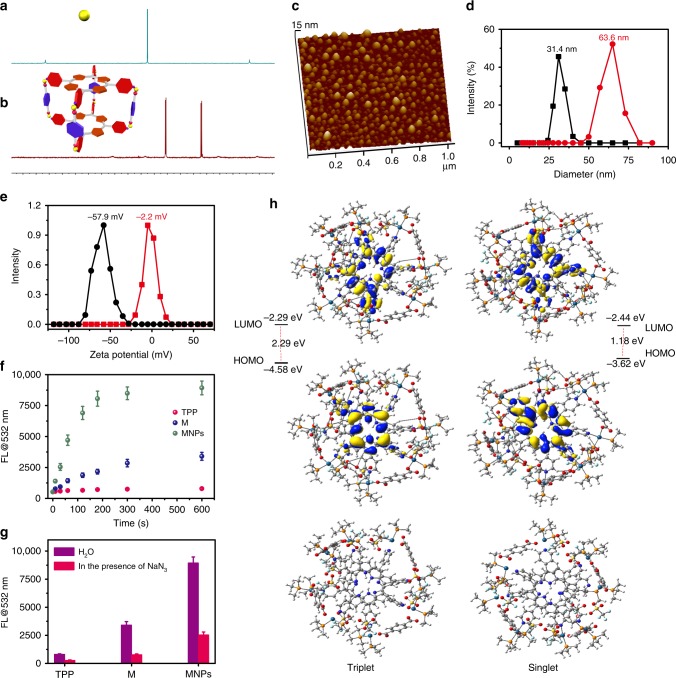
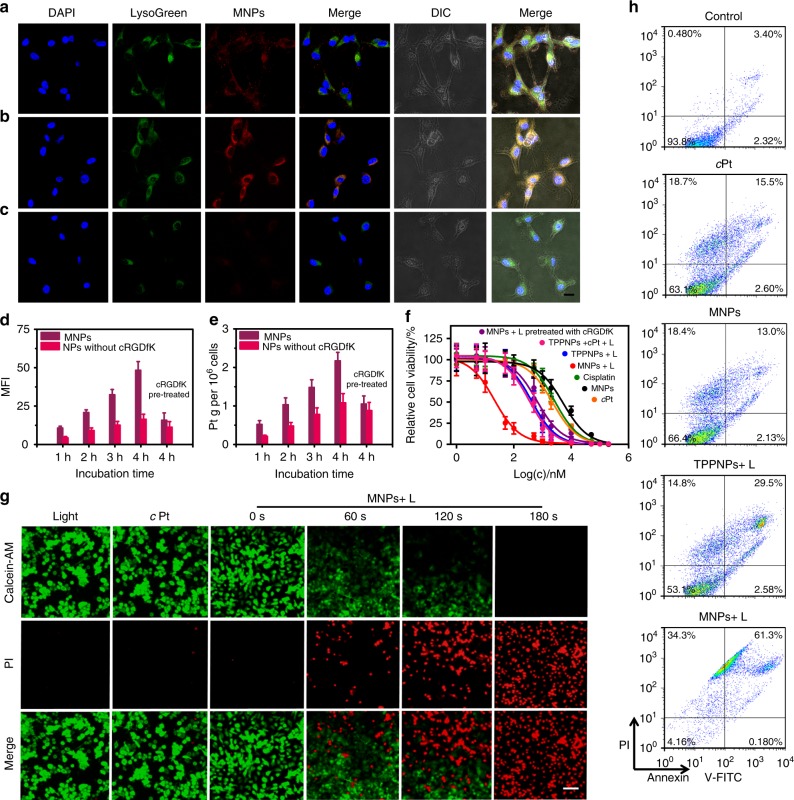
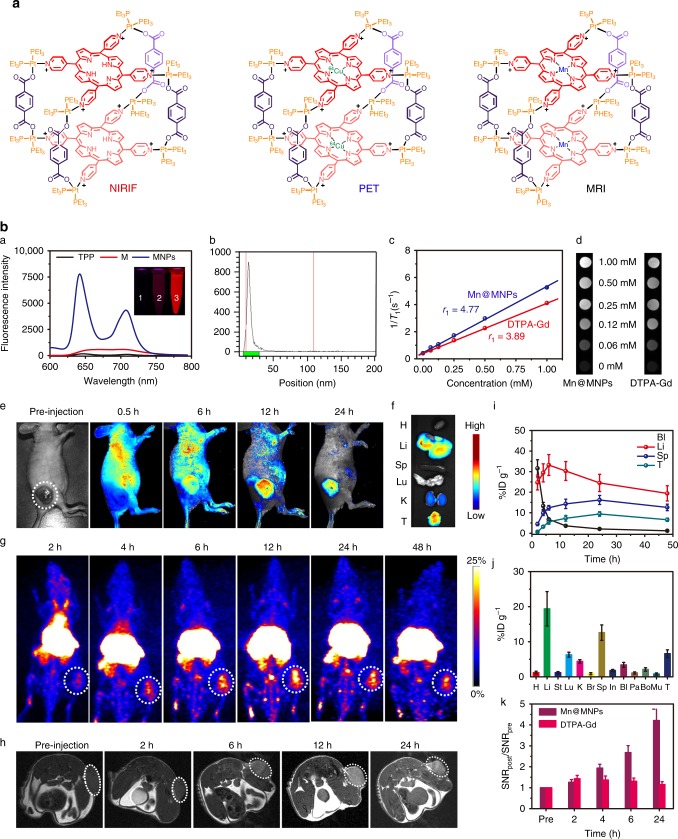
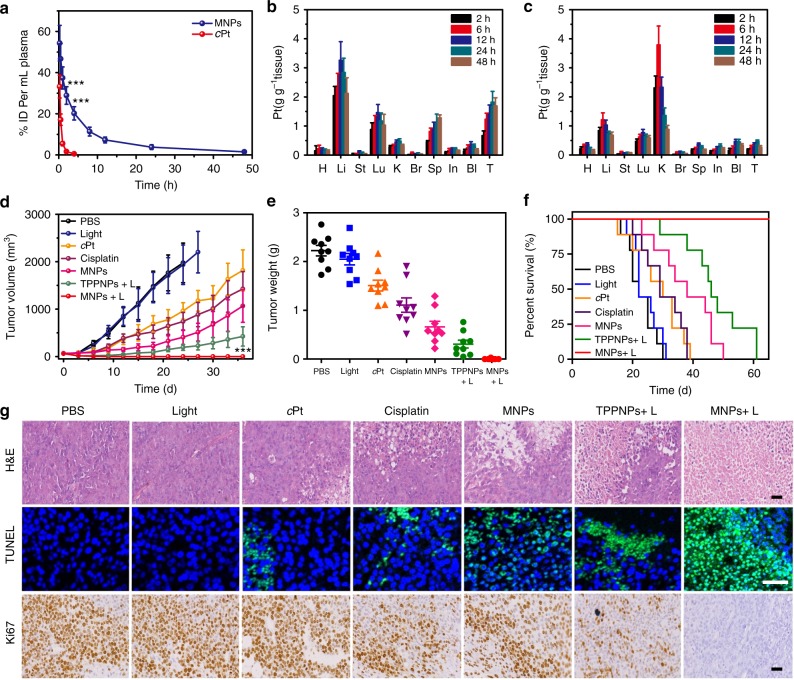
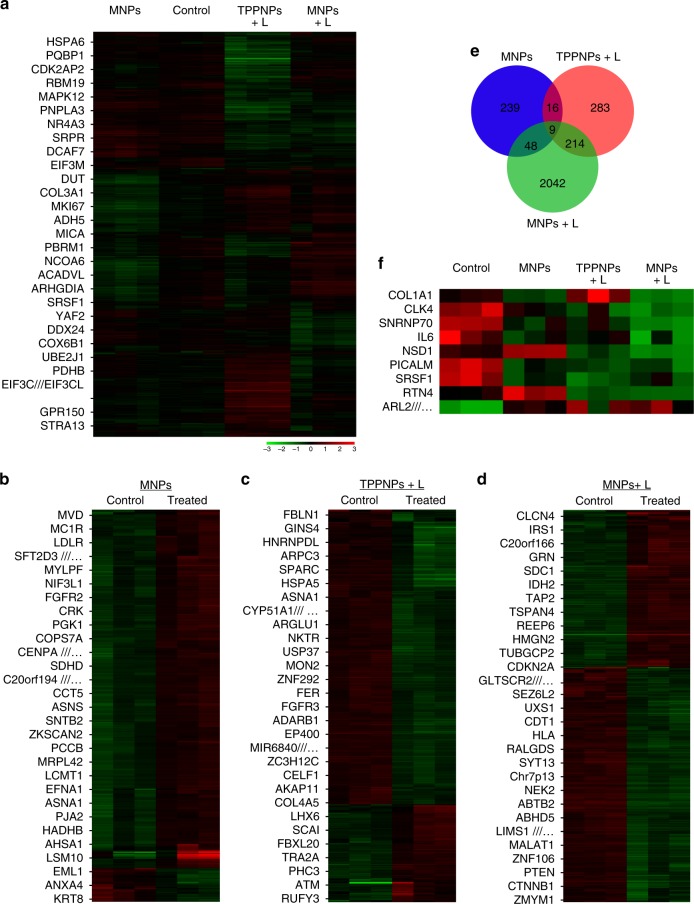
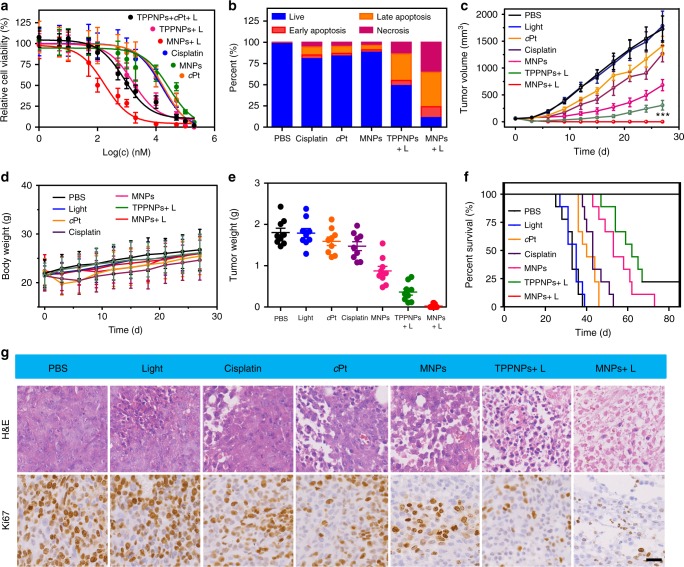
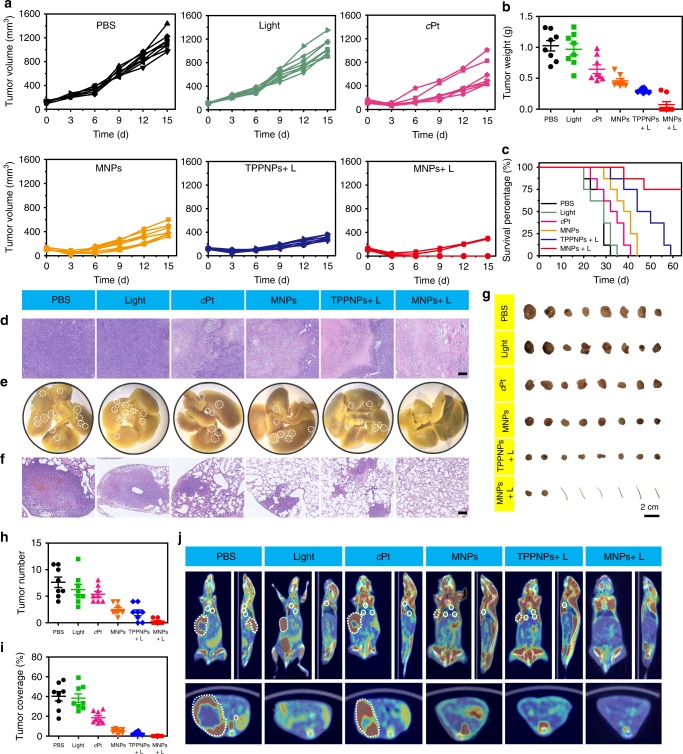
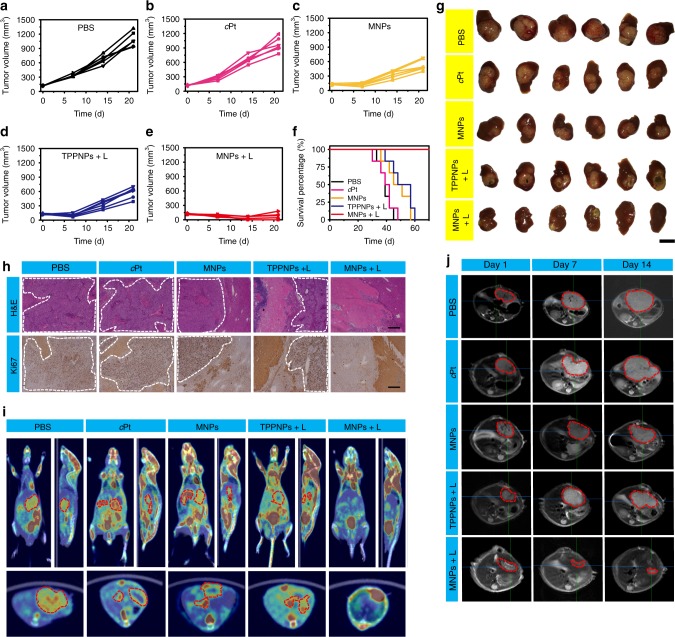
Photodynamic therapy is an effective alternative to traditional treatments due to its minimally invasive nature, negligible systemic toxicity, fewer side effects, and avoidance of drug resistance. However, it is still challenging to design photosensitizers with high singlet oxygen (1O2) quantum yields (QY) due to severe aggregation of the hydrophobic photosensitizers. Herein, we developed a discrete organoplatinum(II) metallacage using therapeutic cis-(PEt3)2Pt(OTf)2 as the building block to improve the 1O2 QY, thus achieving synergistic anticancer efficacy. The metallacage-loaded nanoparticles (MNPs) with tri-modality imaging capability allow precise diagnosis of tumor and real-time monitoring the delivery, biodistribution, and excretion of the MNPs. MNPs exhibited excellent anti-metastatic effect and superior anti-tumor performance against U87MG, drug resistant A2780CIS, and orthotopic tumor models, ablating the tumors without recurrence after a single treatment. Gene chip analyses confirmed the contribution of different therapeutic modalities to the tumor abrogation. This supramolecular platform holds potential in precise cancer theranostics.


Conflict of interest statement

The authors declare no competing interests.

Figures

Fig. 1
Fig. 1
Schematic diagrams of the MNPs serving as a multifunctional theranostic platform. a Structures of TPP, cPt, DSTP, M, mPEG-b-PEBP, and RGD-PEG-b-PEBP. b Schematic illustration of MNPs accumulation in tumor tissue followed by EPR effect and receptor-mediated endocytosis, and their applications in subcutaneous (U87MG), drug-resistant (A2780CIS), orthotopic (4T1 and LM3) tumor treatments, and lung anti-metastasis
Fig. 2
Fig. 2
Characterizations of the MNPs and their PDT effect. 31P{1H} (202.3 MHz, 293 K) of a cPt and b M. c AFM image of the MNPs. d DLS and e Zeta potential results of the NPs formed from mPEG-b-PEBP and RGD-PEG-b-PEBP before (black line) and after (red line) encapsulation of M. f The fluorescence intensity changes at 532 nm of the solution containing SOSG and TPP (M or MNPs) after different periods of irradiation (671 nm, 0.5 W cm–2). g The fluorescence intensity changes at 532 nm of the solution containing SOSG and TPP (M or MNPs) after irradiation (671 nm, 0.5 W cm–2, 10 min) in the absence and presence of NaN3 (10.0 μM). h Time-dependent density functional theory molecular simulation of M. The data are expressed as means ± s.d
Fig. 3
Fig. 3
In vitro targeted delivery activity of the MNPs and synergistic anticancer effect. CLSM images of U87MG cells cultured with MNPs for a 2 h, b 4 h, and c 4 h pre-treated with free cRGDfK for 30 min. Scale bar is 20 μM. d Mean fluorescent intensity (MFI) and e intracellular platinum amount of U87MG cells after treatment with the MNPs or NPs without cRGDfK for different incubation times. f Cytotoxicity of U87MG cells treated with different administrations. g Fluorescence images of U87MG cells co-stained with Calcein AM/PI after different treatments. The platinum concentration of cPt and MNPs was kept at 200 nm. Scale bar is 50 μM. h FCM analysis of U87MG cell apoptosis induced by different treatments. The irradiation density was 0.1 W cm–2 at 671 nm, and the irradiation time was 3 min. The data are expressed as means ± s.d
Fig. 4
Fig. 4
In vivo tri-modality imaging. a Fluorescence spectra of TPP, M, and MNPs. Inset picture is the fluorescent imaging related to the solution (1, TPP; 2, M, 3, MNPs). b Radio TLC chromatograms of 64Cu@MNPs after 24 h incubation in mouse serum. c Plots of T1−1 versus Mn (or Gd) concentration for Mn@MNPs (or DTPA-Gd). d T1-weighted MRI results (7T) obtained from aqueous solution of Mn@MNPs (or DTPA-Gd) at various Mn (or Gd) concentrations. e NIRFI of U87MG tumor-bearing nude mice following i.v. injection of MNPs. The white circle denotes the tumor site. f Ex vivo image of the main organs separated from U87MG tumor-bearing mice at 24 h post injection of MNPs. g PET image of U87MG tumor-bearing nude mice at 2, 4, 6, 12, 24, and 48 h post injection of 64Cu@MNPs (150 μCi). The white circle denotes the tumor site. h In vivo T1-weighted axial MRI images (7T) of the mice pre-injection and after injection of Mn@MNPs. The white circle denotes the tumor site. i Time-activity curves of the biodistribution of 64Cu@MNPs in the blood, liver, spleen, and tumor (n = 3). j Quantitative biodistribution of 64Cu@MNPs in the main organs 48 h post injection of 64Cu@MNPs. H heart, Li liver, St stomach, Lu lung, K kidney, Br brain, Sp spleen, In intestine, Bl bladder, Pa pancreas, Bo bone, Mu muscle, T tumor. k Quantificational analysis of SNR ratio in tumor sites at 2, 4, 6, and 24 h post injection of Mn@MNPs or DTPA-Gd (n = 3). The data are expressed as means ± s.d
Fig. 5
Fig. 5
In vivo synergistic anti-tumor effect. a Plasma platinum concentration versus time after injection of cPt and the MNPs (2 mg Pt per kg) (n = 4). Biodistributions of Pt at different time points after injection of b MNPs and c cPt (2 mg Pt per kg) (n = 4). H heart, Li liver, St stomach, Lu lung, K kidney, Br brain, Sp spleen, In intestine, Bl bladder, T tumor. d Tumor growth curves for the mice after different formulations (n = 9). e Weight of U87MG tumors from the mice received different formulations. f Kaplan–Meier plots of the mice bearing U87MG tumors after treatment with different formulations. The irradiation density was 0.3 W cm–2 at 671 nm, and the irradiation time was 10 min. g H&E, TUNEL, and Ki67 staining of tumor tissues collected from the mice administrated with various formulations. Scale bar is 100 μM. The data are expressed as means ± s.d., ***P < 0.001
Fig. 6
Fig. 6
Whole-gene expression analyses of tumors from the mice treated with different formulations. a Heat-map for GeneChip® PrimeView™ Human Gene Expression Array of mice treated with chemotherapy, PDT or photochemotherapy. Altered genetic profile of tumors treated with b MNPs, c TPPNPs + L, or d MNPs + L compared with the untreated control group. e The venn diagram that displays the number of common characteristics among significantly altered genes from three different treatments. Arabic numerals represent the number of significantly altered genes. f Selection of potential gene targets involved in tumor regression in response to different therapies
Fig. 7
Fig. 7
In vivo anti-tumor efficacy against resistant cancer model. a Cytotoxicity of A2780CIS cells treated with different administrations. The irradiation density was 0.1 W cm–2 at 671 nm and the irradiation time was 3 min. b Annexin V/PI analyses of A2780CIS cells after different treatments. c In vivo tumor growth inhibition curves and d body weight changes of the mice after different treatments (n = 9). e Weight of A2780CIS tumors after different treatments. f Kaplan–Meier plots of the mice treated with different treatments. The irradiation density was 0.3 W cm–2 at 671 nm and the irradiation time was 10 min. g H&E and Ki67 analyses of tumor tissues after different treatments. Scale bar is 50 μM. The data are expressed as means ± s.d., ***P < 0.001
Fig. 8
Fig. 8
Treatment of orthotopic breast cancer and inhibitory effects on lung metastasis. a Tumor volume changes of the mice treated with PBS, light, cPt, MNPs, TPPNPs + L, or MNPs + L after one injection (n = 8). b Tumor weight of the mice treated with different formulations. c Kaplan–Meier survival curves of the mice bearing orthotopic 4T1 breast tumors treated with different formulations. d H&E staining of the tumor tissues from each group. Scale bar is 500 μM. e Representative images of the lungs excised from each group. The white circles denote the visually detected metastatic nodules in each lung tissue. f Histological examination of metastatic lesions in lung tissues from each group after H&E staining. Scale bar is 500 μM. g Photo images of the orthotopic tumors harvested from the mice treated with different formulations. Mice tails indicate no tumor founded. h The numbers of tumor nodules present in the lungs from each group. i Tumor coverage percentage in the lungs from each group. j PET/CT images of the mice treated with different formulations at the 14th day post injection. The white dash circles denote the orthotopic breast tumors, and the white solid circles denote the metastatic tumors. The laser density was 0.3 W cm–2 at 671 nm, and the irradiation time was 10 min. The data are expressed as means ± s.d., ***P < 0.001
Fig. 9
Fig. 9
Treatment of orthotopic liver cancer. Tumor volume changes of the mice bearing orthotopic LM3 tumors treated with a PBS, b cPt, c MNPs, d TPPNPs + L, or e MNPs + L after one injection (n = 6). f Kaplan–Meier survival curves of the mice bearing orthotopic LM3 tumors treated with different formulations. g Photo images of the liver tissues containing LM3 tumors collected from the mice treated with different formulations. h H&E and Ki67 staining of the liver tissues from each group. The white dashed circles denote the tumor tissues. Scale bar is 500 μM. i PET/CT images of the mice treated with different formulations. The red dash circles denote the orthotopic hepatocellular carcinoma tumors. (j) MRI images of the mice treated with different formulations. The red dashed circles denote the orthotopic hepatocellular carcinoma tumors. The laser density was 0.3 W cm–2 at 671 nm, and the irradiation time was 10 min. The data are expressed as means ± s.d

References

    1. Chabner BA, Roberts TG., Jr. Chemotherapy and the war on cancer. Nat. Rev. Cancer. 2005;5:65–72. doi: 10.1038/nrc1529. - DOI - PubMed
    1. Shi J, Kantoff PW, Wooster R, Farokhzad OC. Cancer nanomedicine: progress, challenges and opportunities. Nat. Rev. Cancer. 2017;17:20–37. doi: 10.1038/nrc.2016.108. - DOI - PMC - PubMed
    1. Mura S, Nicolas J, Couvreur P. Stimuli-responsive nanocarriers for drug delivery. Nat. Mater. 2013;12:991–1003. doi: 10.1038/nmat3776. - DOI - PubMed
    1. Ferrari M. Cancer nanotechnology: opportunities and challenges. Nat. Rev. Cancer. 2005;5:161–171. doi: 10.1038/nrc1566. - DOI - PubMed
    1. Chen H, Zhang W, Zhu G, Xie J, Chen X. Rethinking cancer nanotheranostics. Nat. Rev. Mater. 2017;2:17024. doi: 10.1038/natrevmats.2017.24. - DOI - PMC - PubMed

Publication types

MeSH terms

Substances