. 2018 Oct 18;8(1):15351.
doi: 10.1038/s41598-018-33619-0.

Non-invasive continuous real-time in vivo analysis of microbial hydrogen production shows adaptation to fermentable carbohydrates in mice

Affiliations

Non-invasive continuous real-time in vivo analysis of microbial hydrogen production shows adaptation to fermentable carbohydrates in mice

José M S Fernández-Calleja et al. Sci Rep. .

Abstract

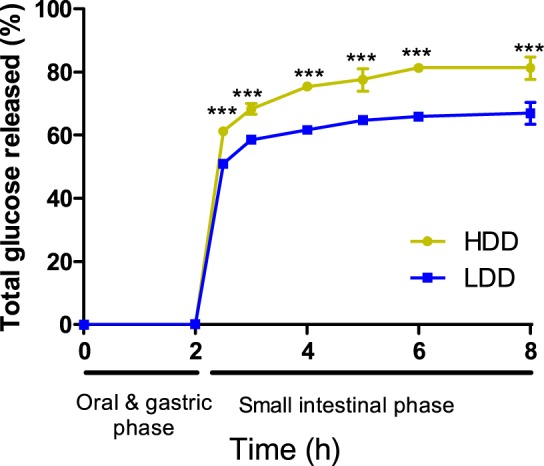
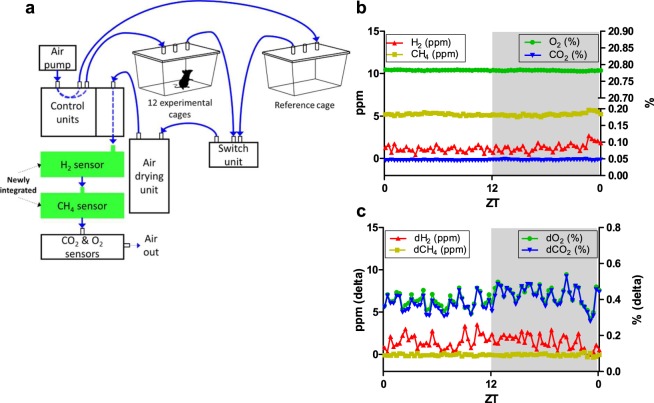
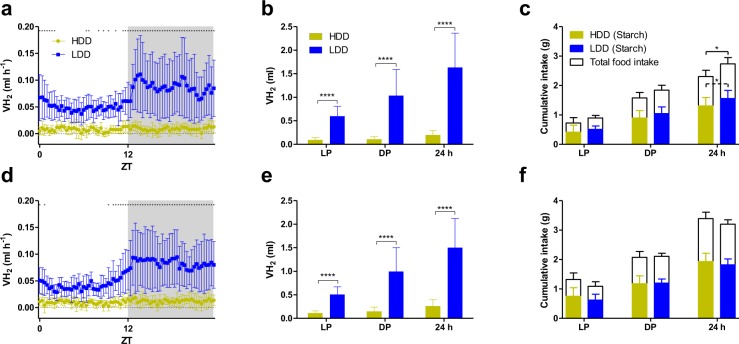
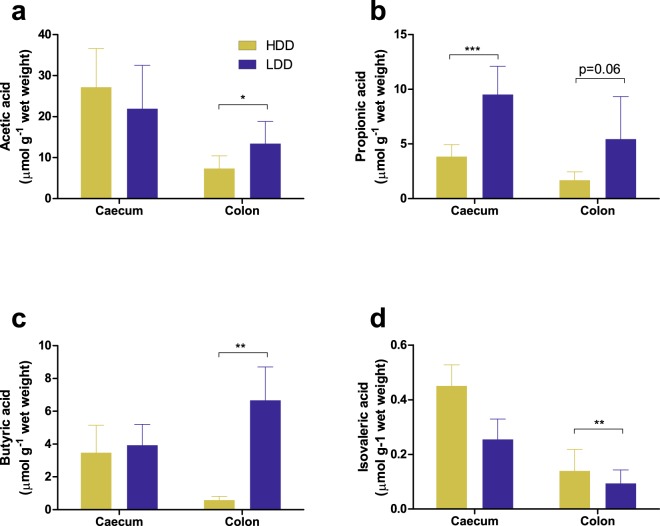
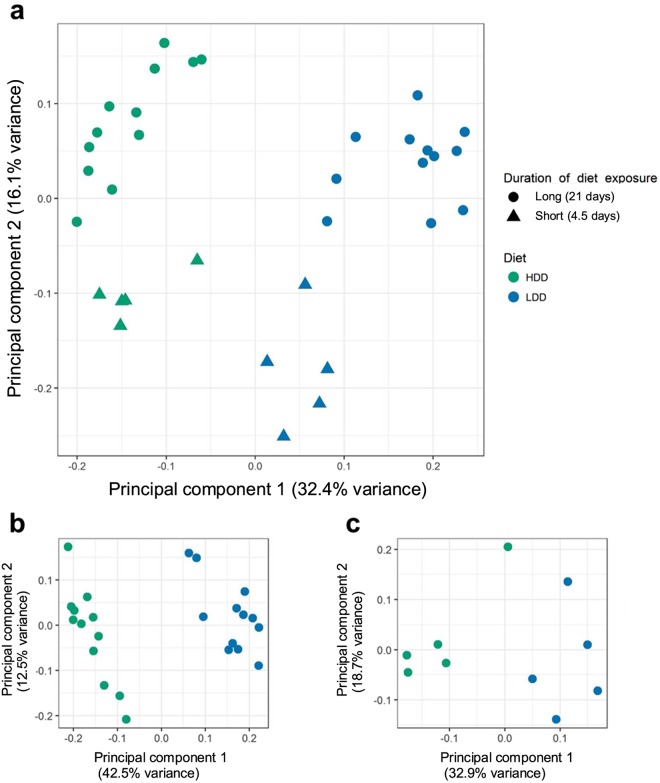
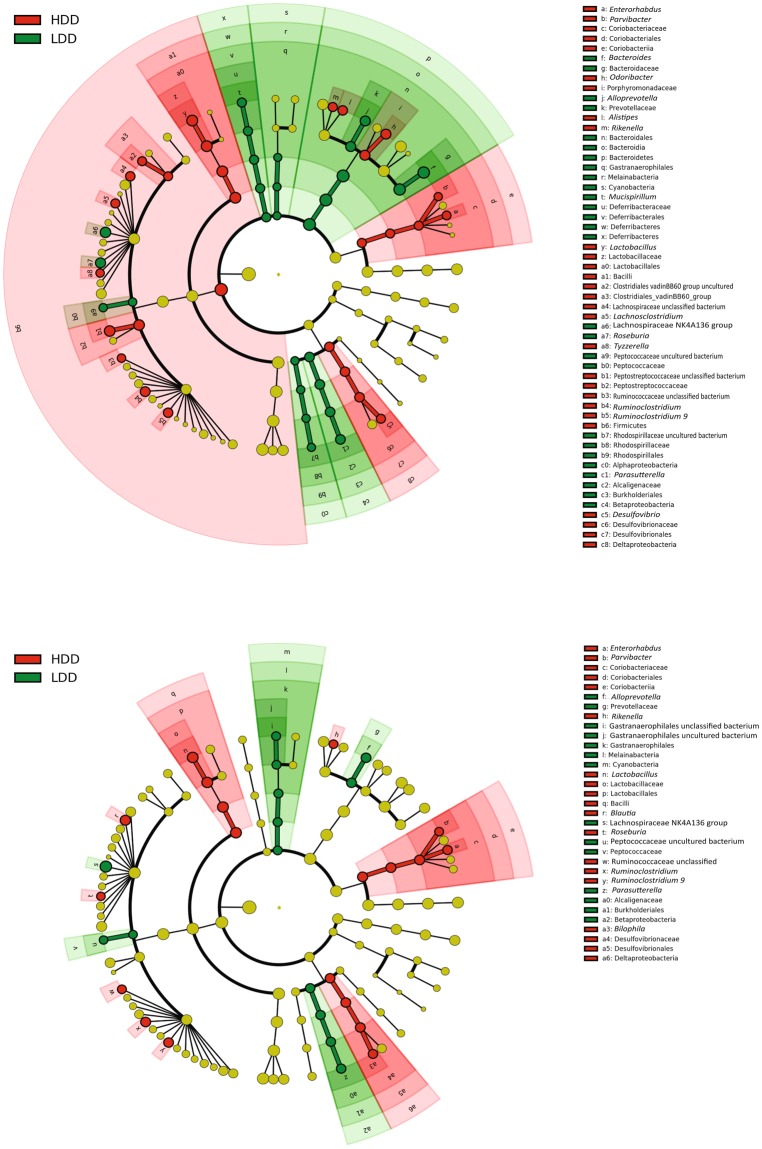
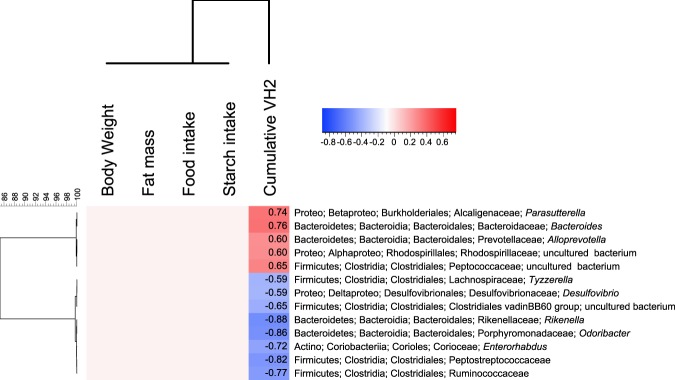
Real time in vivo methods are needed to better understand the interplay between diet and the gastrointestinal microbiota. Therefore, a rodent indirect calorimetry system was equipped with hydrogen (H2) and methane (CH4) sensors. H2 production was readily detected in C57BL/6J mice and followed a circadian rhythm. H2 production was increased within 12 hours after first exposure to a lowly-digestible starch diet (LDD) compared to a highly-digestible starch diet (HDD). Marked differences were observed in the faecal microbiota of animals fed the LDD and HDD diets. H2 was identified as a key variable explaining the variation in microbial communities, with specific taxa (including Bacteroides and Parasutterella) correlating with H2 production upon LDD-feeding. CH4 production was undetectable which was in line with absence of CH4 producers in the gut. We conclude that real-time in vivo monitoring of gases provides a non-invasive time-resolved system to explore the interplay between nutrition and gut microbes in a mouse model, and demonstrates potential for translation to other animal models and human studies.


Conflict of interest statement

N.B. and V.G.-C. are employed by Cargill. A.O. is employed by Danone Nutricia Research.

Figures

Figure 1
Figure 1
In vitro digestibility of starches in experimental diets. Triplicate samples of the lowly- and highly-digestible starch diets (LDD and HDD, respectively) were digested in vitro, and free glucose concentrations were determined at indicated time points. Statistical comparisons were made with two-way ANOVA with Bonferroni’s post hoc test; ***P ≤ 0.001. Values are plotted as mean ± s.d.
Figure 2
Figure 2
Real-time measurements of hydrogen (H2) and methane (CH4) production in mice within indirect calorimetry system. (a) Illustration of the indirect calorimetry system extended for H2 and CH4 measurements. Direction of air flow in the tubing is shown in blue, new gas sensors are shown in green. For clarity, tube lengths are not to scale (all equal) and food and drink containers with sensors are not shown, nor are the infrared beam bars for activity measurements. (b) Ambient concentrations of H2 and CH4 (left y-axis, ppm) and O2 and CO2 (right y-axis, %) were recorded in an empty (reference) cage at 20 min intervals for 24 h. (c) Gas concentrations in a cage occupied by a chow-fed female adult mouse were measured and compared to the corresponding concentrations in the reference cage and expressed as delta values. White and grey areas in panels b and c represent the inactive light and active dark phase for the animal, respectively. ZT, Zeitgeber time.
Figure 3
Figure 3
H2 production in mice reflects starch digestibility. Female (a) and male (d) mice were fed either HDD or LDD for three weeks and volume of H2 produced (VH2) was recorded for 24 h in the adapted indirect calorimetry system. Cumulative H2 production in females (b) and males (e) quantified during the 12 h light phase (LP), 12 h dark phase (DP) or the complete 24 h photoperiod. Cumulative starch and total food intake in females (c) and males (f) over the measuring period calculated from food intake records. White and grey areas represent the light and the dark phase, respectively. Time course data was analysed by repeated measures two-way ANOVA with Bonferroni’s test for multiple comparisons and time points where P < 0.05 are indicated with black asterisks (panels a and d). Other statistical comparisons made by Student’s t-test or Mann-Whitney U test; *P ≤ 0.05, ****P < 0.0001 (n = 11 LDD females, n = 12 remaining groups). Data shown as mean ± s.d. ZT, Zeitgeber time.
Figure 4
Figure 4
H2 evolution upon first exposure to starches of different digestibility. (a) Standard chow-fed mice within indirect calorimetry were food-restricted leading to fasting (dotted line), which was followed by feeding 1.1 g of chow (black), HDD (yellow), or LDD (blue; n = 4 per group) prior to the dark phase as a single meal test (2nd dotted line). As a result, they were fasted the next day, and received prior to dark phase ad libitum access to the same diet (3rd dotted line) for an additional 5.5 days. Inset: First 12 h cumulative starch-intake of ad libitum feeding with experimental diets. (b) Chow-fed mice (n = 6 per group) were switched to LDD or HDD without prior food restriction and measurements continued for another 4.5 days. Inset: First 12 h cumulative starch-intake after diet switch. (c) Cumulative H2 production over 12 h before (while food-restricted on chow) and after feeding 1.1 g of chow, HDD, or LDD (n = 4 per group). (d) Cumulative H2 production over 12 h before and after switching directly from chow to HDD or LDD (n = 6 per group). All mice received no other diet than chow during their whole lifetime prior to these experiments and the dietary switch (black bar), but colour usage reflects subgroups after first exposure to new diets. White and grey areas represent light and dark phases, respectively. Time course data was analysed by repeated measures two-way ANOVA with Bonferroni’s test for multiple comparisons (chow vs HDD, LDD vs chow, and LDD vs HDD), and time points where P < 0.05 are indicated with black stars (panels a,b). Cumulative data was statistically compared using unpaired two-tailed Student’s t-test (between HDD and LDD) and one-way ANOVA with Bonferroni’s multiple comparisons post hoc test (between chow, HDD, and LDD); *P ≤ 0.05, **P ≤ 0.01. Data is presented as mean ± s.d. For clarity, either upper or lower error bars are shown. ZT, Zeitgeber time.
Figure 5
Figure 5
Short-chain fatty acid (SCFA) concentrations in intestinal digesta of mice fed starches of different digestibility. (a) Acetic acid, (b) propionic acid, (c) butyric acid and (d) isovaleric acid concentrations in mouse caecum (n = 6 per group) and colon (n = 5 HDD, n = 7 LDD) contents obtained after three weeks of feeding HDD (yellow bars) or LDD (blue bars). Statistical comparisons were made using unpaired two-tailed Student’s t-test; *P ≤ 0.05, **P ≤ 0.01, ***P ≤ 0.001, ****P < 0.0001. Data shown as mean ± s.d.
Figure 6
Figure 6
Starch digestibility primarily determines faecal microbiota composition. Principal coordinates analysis (PCoA) plot illustrating the unweighted UniFrac distances of the intestinal microbiota of mice after long- and short-term exposure to HDD and LDD (a, Studies 1 and 3 combined), and only long-term (b, Study 1) and short-term (c, Study 3) exposures. Each data point represents a sample of faecal pellets of one individual mouse (n = 12 long-term exposure per diet, n = 5 short-term exposure per diet).
Figure 7
Figure 7
Exposure to starches of different digestibility induces distinct microbial taxa. (a) Cladogram representing bacteria genera that were significantly enriched by LDD or HDD after 3 weeks of exposure to the diets (n = 12 per diet, Study 1). (b) Bacterial genera that were significantly increased by LDD or HDD after 4.5 d of exposure to the diets (n = 5 per diet, Study 3). Comparisons were done using the linear discriminant analysis effect size (LEfSe) method. LDA scores are shown in Additional file 3: Fig. 3e,f. Nomenclature of microbial genus level taxa is based on highest achievable taxonomic resolution at phylum, class, order, family or genus level.
Figure 8
Figure 8
Specific bacterial genera correlate only with in vivo H2 production. Spearman’s rank correlation coefficients of faecal microbiota, H2 production, food and starch intake, body weight, and fat mass of mice exposed to HDD or LDD for 3 weeks after weaning (n = 12 per diet, Study 1). Non-red and non-blue cells all have a Spearman’s correlation value of 0 with FDR P value > 0.13. Nomenclature of microbial genus level taxa is based on highest achievable taxonomic resolution at phylum, class, order, family or genus level.

Similar articles

Cited by

References

    1. Englyst KN, Liu S, Englyst HN. Nutritional characterization and measurement of dietary carbohydrates. Eur. J. Clin. Nutr. 2007;61(Suppl 1):S19–39. doi: 10.1038/sj.ejcn.1602937. - DOI - PubMed
    1. Elia M, Cummings JH. Physiological aspects of energy metabolism and gastrointestinal effects of carbohydrates. Eur. J. Clin. Nutr. 2007;61(Suppl 1):S40–74. doi: 10.1038/sj.ejcn.1602938. - DOI - PubMed
    1. den Besten G, et al. The role of short-chain fatty acids in the interplay between diet, gut microbiota, and host energy metabolism. J. Lipid. Res. 2013;54:2325–2340. doi: 10.1194/jlr.R036012. - DOI - PMC - PubMed
    1. Silk DB, Webb JP, Lane AE, Clark ML, Dawson AM. Functional differentiation of human jejunum and ileum: a comparison of the handling of glucose, peptides, and amino acids. Gut. 1974;15:444–449. doi: 10.1136/gut.15.6.444. - DOI - PMC - PubMed
    1. Flint HJ, Scott KP, Louis P, Duncan SH. The role of the gut microbiota in nutrition and health. Nat. Rev. Gastroenterol. Hepatol. 2012;9:577–589. doi: 10.1038/nrgastro.2012.156. - DOI - PubMed

Publication types