. 2018 Oct 18;8(1):15454.
doi: 10.1038/s41598-018-33525-5.

E-cadherin loss induces targetable autocrine activation of growth factor signalling in lobular breast cancer

Affiliations

E-cadherin loss induces targetable autocrine activation of growth factor signalling in lobular breast cancer

Katy Teo et al. Sci Rep. .

Abstract

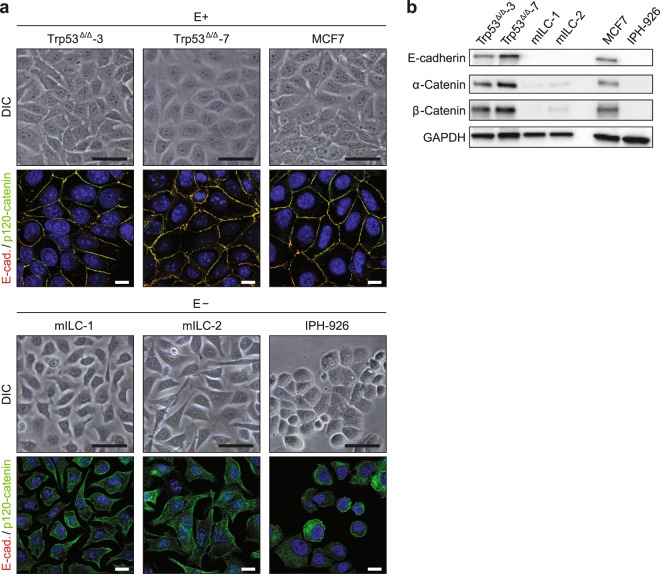
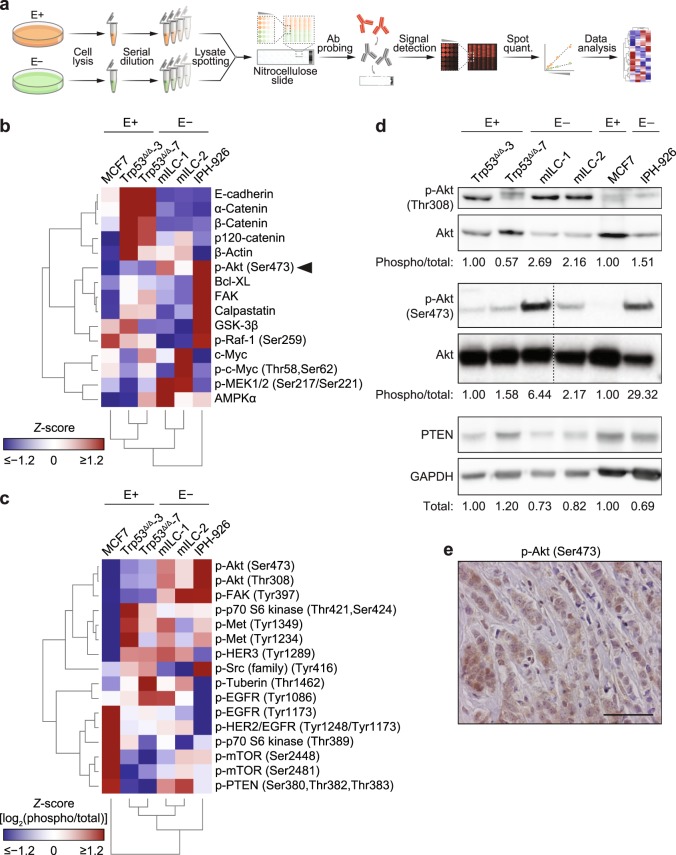
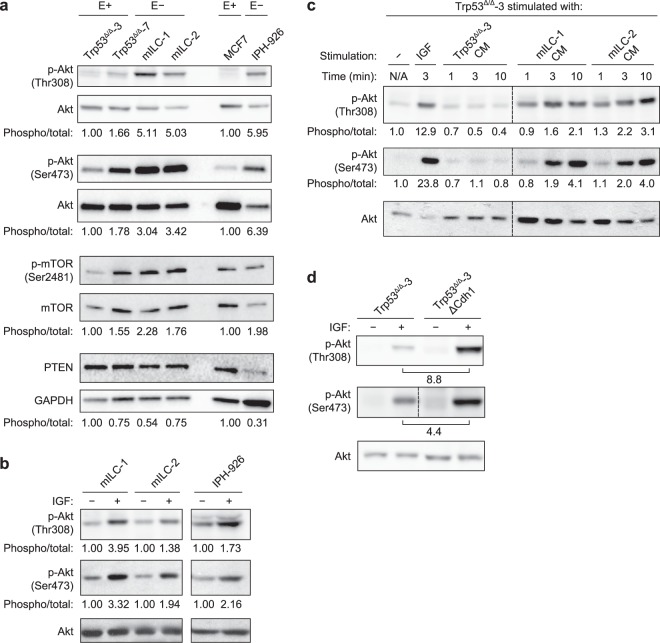
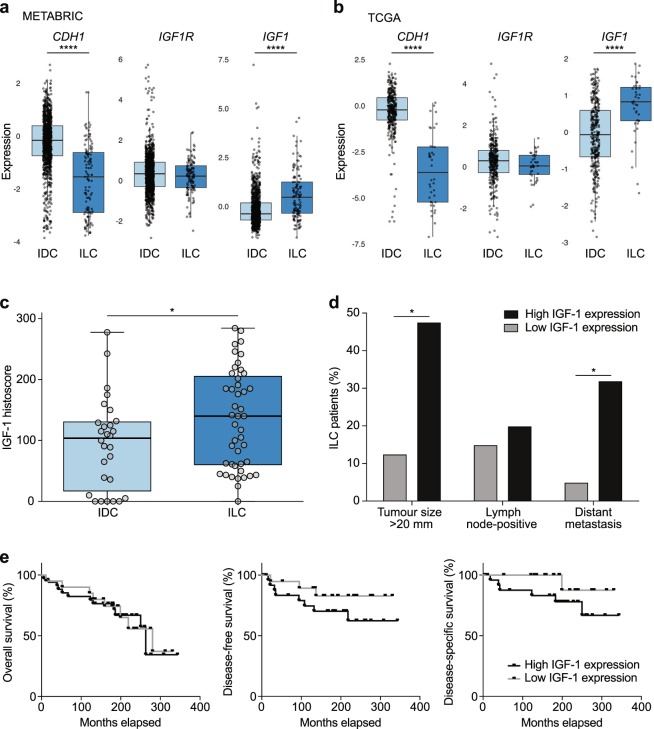
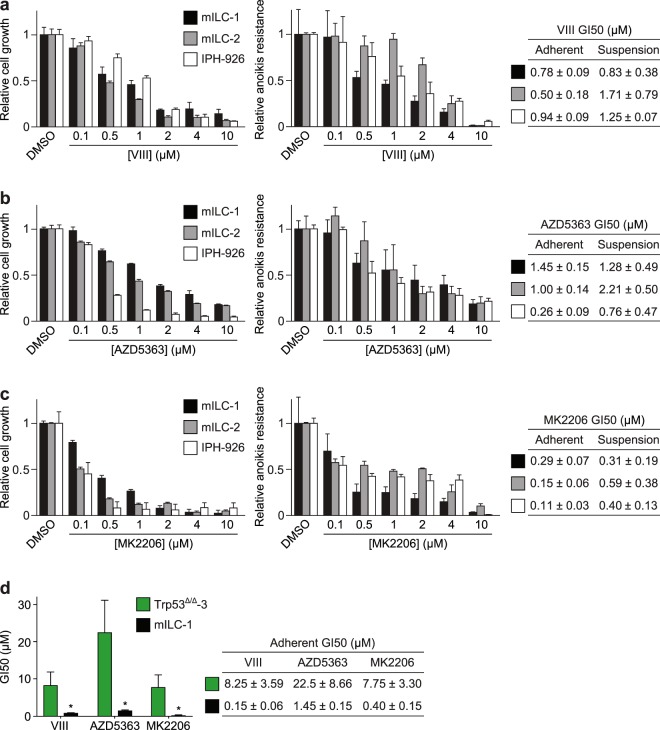
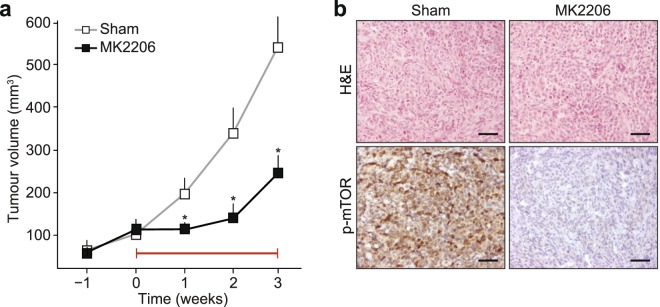
Despite the fact that loss of E-cadherin is causal to the development and progression of invasive lobular carcinoma (ILC), options to treat this major breast cancer subtype are limited if tumours develop resistance to anti-oestrogen treatment regimens. This study aimed to identify clinically targetable pathways that are aberrantly active downstream of E-cadherin loss in ILC. Using a combination of reverse-phase protein array (RPPA) analyses, mRNA sequencing, conditioned medium growth assays and CRISPR/Cas9-based knock-out experiments, we demonstrate that E-cadherin loss causes increased responsiveness to autocrine growth factor receptor (GFR)-dependent activation of phosphatidylinositol-4,5-bisphosphate 3-kinase (PI3K)/Akt signalling. Autocrine activation of GFR signalling and its downstream PI3K/Akt hub was independent of oncogenic mutations in PIK3CA, AKT1 or PTEN. Analyses of human ILC samples confirmed growth factor production and pathway activity. Pharmacological inhibition of Akt using AZD5363 or MK2206 resulted in robust inhibition of cell growth and survival of ILC cells, and impeded tumour growth in a mouse ILC model. Because E-cadherin loss evokes hypersensitisation of PI3K/Akt activation independent of oncogenic mutations in this pathway, we propose clinical intervention of PI3K/Akt in ILC based on functional E-cadherin inactivation, irrespective of activating pathway mutations.


Conflict of interest statement

The authors declare no competing interests.

Figures

Figure 1
Figure 1
Breast cancer cells used in this study. (a) Differential interference contrast (DIC) microscopy images and merged immunofluorescence microscopy images for E-cadherin (E-cad.; red) and p120-catenin (green) expression in mouse (left and middle panels) and human (right panels) breast cancer cell lines. E-cadherin-expressing (E+; upper panels) and E-cadherin mutant (E−; lower panels) cells are grouped accordingly. Scale bars for DIC, 20 µm; scale bars for immunofluorescence, 10 µm. (b) Expression of the AJ components E-cadherin, α-catenin and β-catenin was assessed by western blotting. GAPDH served as a loading control.
Figure 2
Figure 2
Differential protein expression and phosphorylation in the context of E-cadherin expression. (a) Experimental workflow for the RPPA analysis. After collection, dilution and spotting of the cell lysates, each of 16 sub-arrays (pads) per nitrocellulose slide were probed with a different validated primary antibody (Ab). A fluorescent secondary antibody was used for signal detection and quantification (quant.). Mean intensities of the biological replicates were used to perform cluster analysis. E+, E-cadherin-expressing cells; E−, E-cadherin-negative cells. (b) Hierarchically clustered heat map showing the relative levels of differentially regulated proteins and phosphoproteins (Q = 0.05) in whole cell lysates from mouse (Trp53Δ/Δ-3, Trp53Δ/Δ-7, mILC-1, mILC-2) and human (MCF7, IPH-926) cell lines as determined by RPPA. (c) Hierarchically clustered heat map showing the relative levels of phosphoproteins related to the Akt signalling pathway. Heat maps display the relative expression (Z-scores) of proteins or phosphoproteins (red, up-regulated; blue, down-regulated). (d) Western blot analysis of differentially regulated proteins and phosphoproteins identified by RPPA. Phosphorylation levels of Akt (p-Akt; Thr308 and Ser473) were assessed and normalised over the corresponding total protein levels, while PTEN expression levels were normalised over GAPDH levels. For mouse cells, normalised phosphoprotein levels in Trp53Δ/Δ-3 cells were set to 1; for human cells, normalised phosphoprotein levels in MCF7 cells were set to 1. For analysis of phospho-Akt (Ser473), blot lanes for additional mILC sub-clones were removed, as denoted by the dashed lines. (e) Representative immunohistochemistry image of expression of phospho-Akt (Ser473) in ILC patients (see Table 2). Scale bars, 50 µm.
Figure 3
Figure 3
Autocrine growth factor-dependent PI3K/Akt activation is a direct consequence of E-cadherin loss in ILC. (a) PI3K/Akt signalling in E-cadherin-expressing (E+) and E-cadherin mutant (E−) ILC cells. Shown are the phosphorylation status of Akt (Thr308 and Ser473), the phosphorylation status of mTOR (Ser2481) and the expression of PTEN. Quantification of mouse protein expression is relative to the levels in Trp53Δ/Δ-3 cells and human protein expression is relative to the levels in MCF7 cells. Phosphorylation of Akt (Thr308 and Ser473) and mTOR (Ser2481) were normalised over total protein levels; PTEN levels were normalised over GAPDH levels. (b) Phosphorylation of Akt (Thr308 and Ser473) is induced upon IGF stimulation of E-cadherin-negative cells. Quantification of protein levels is relative to the levels in unstimulated cells. Separate gels were run with the mILC and IPH-926 cell lines. (c) Stimulation of Trp53Δ/Δ-3 cells with IGF and mILC-conditioned medium (CM) induces phosphorylation of Akt. Akt phosphorylation levels in unstimulated cells were set to 1. Replicate blot lanes for cells stimulated with conditioned medium were removed, as denoted by the dashed lines. N/A, not applicable. (d) E-cadherin knockout (ΔCdh1) in Trp53Δ/Δ-3 cells increases basal levels of phospho-Akt. Stimulation of serum-starved cells with IGF induces an increase in Akt phosphorylation in ΔCdh1 cells. Phospho-Akt (Ser473) and phospho-Akt (Ser308) were analysed on separate gels. For analysis of phospho-Akt (Ser473), blot lanes for additional CRISPR clones were removed, as denoted by the dashed line.
Figure 4
Figure 4
IGF-1 expression is increased in human ILC versus IDC. (a,b) Boxplots of expression for CDH1, IGF1R and IGF1 genes from METABRIC (a) and TCGA (b) microarray mRNA expression datasets. All data points are ER-positive breast cancer samples. For further details, see Supplementary Table S5. Boxplots display the median (line), 25th and 75th percentiles (box) and 1.5 × interquartile range (whiskers). Light blue, IDC; dark blue, ILC. ****P < 0.0001; Wilcoxon test. (c,d) Analysis of IGF-1 cytoplasmic expression in a human TMA containing ILC and IDC samples. Boxplot (c) summarises IGF-1 histoscores. *P < 0.05; Mann–Whitney test. Histograms (d) show significant correlation between high cytoplasmic IGF-1 expression and increased tumour size and relapse with distant metastasis. *P < 0.05; tumour size, Pearson’s chi-squared test; distant metastasis, Fisher’s exact test. Lymph node status, P = 0.633; Fisher’s exact test. For further details, see Supplementary Table S6. (e) Kaplan–Meier plots representing proportions of patient survival. Disease-free survival was defined as time from primary surgery to first occurrence of relapsed disease (loco-regional recurrence and/or distant metastasis), and disease-specific survival was defined as time from primary surgery to breast cancer-related death. Overall survival (left panel), P = 0.869; disease-free survival (middle panel), P = 0.210; disease-specific survival (right panel), P = 0.135; log-rank test.
Figure 5
Figure 5
ILC tumour growth and survival is dependent on Akt activation. (ac) Effect of Akt inhibitors VIII (a), AZD5363 (b) and MK2206 (c) on cell growth (left panels) and anoikis resistance (middle panels) of mILC-1 (black bars), mILC-2 (grey bars) and IPH-926 (white bars) cells. The GI50 values (µM) for each inhibitor in adherent and suspension settings are shown in tables (right panels). GI50 values were calculated based on three independent experiments. (d) E-cadherin inactivation induces sensitivity to pharmacological Akt inhibition in adherent cells. Shown is a comparison of GI50 values based on colony formation assays of Trp53∆/∆-3 cells (green bars) versus mILC-1 cells (black bars) (left panel). The GI50 values (µM) for each inhibitor for the cell types are shown in a table (right panel). Note the difference in sensitivity to the Akt inhibitors VIII, AZD5363 and MK2206. *P < 0.05; Student’s t-test.
Figure 6
Figure 6
MK2206 inhibits tumour growth in a mouse model of ILC. (a) Mouse ILC cells (mILC-1) were allowed to form primary tumours in recipient nude mice, and treatment with MK2206 (120 mg/kg) was commenced when mammary tumours reached an average volume of 100 mm3 (n = 13). Sham-treated animals (n = 13) were used as control. Preclinical intervention was continued for three weeks (denoted by red line), after which the experiment was ended. *P < 0.005. (b) Owing to the allosteric nature of the MK2206 inhibitor, inhibition of Akt signals in primary tumours was probed using immunohistochemical analysis of phosphorylated mTOR, a key downstream PI3K/Akt effector (lower panels). Note the inhibition of ILC growth (a) and phospho-mTOR (b) upon MK2206 treatment. H&E, haematoxylin and eosin staining. Sham, 30% captisol. Scale bars, 50 µm.

References

    1. Berx G, et al. E-cadherin is a tumour/invasion suppressor gene mutated in human lobular breast cancers. EMBO J. 1995;14:6107–6115. doi: 10.1002/j.1460-2075.1995.tb00301.x. - DOI - PMC - PubMed
    1. Vos C, et al. E-cadherin inactivation in lobular carcinoma in situ of the breast: an early event in tumorigenesis. Br. J. Cancer. 1997;76:1131–1133. doi: 10.1038/bjc.1997.523. - DOI - PMC - PubMed
    1. Schackmann RCJ, et al. Cytosolic p120-catenin regulates growth of metastatic lobular carcinoma through Rock1-mediated anoikis resistance. J. Clin. Invest. 2011;121:3176–3188. doi: 10.1172/JCI41695. - DOI - PMC - PubMed
    1. van de Ven RAH, et al. Nuclear p120-catenin regulates the anoikis resistance of mouse lobular breast cancer cells through Kaiso-dependent Wnt11 expression. Dis. Model. Mech. 2015;8:373–384. doi: 10.1242/dmm.018648. - DOI - PMC - PubMed
    1. Vlug E, Ercan C, van der Wall E, van Diest PJ, Derksen PWB. Lobular breast cancer: pathology, biology, and options for clinical intervention. Arch. Immunol. Ther. Exp. 2014;62:7–21. doi: 10.1007/s00005-013-0251-0. - DOI - PubMed

Publication types

MeSH terms