. 2018 Oct 18;8(1):15347.
doi: 10.1038/s41598-018-33684-5.

Plasmid-normalized quantification of relative mitochondrial DNA copy number

Affiliations

Plasmid-normalized quantification of relative mitochondrial DNA copy number

Federica Fazzini et al. Sci Rep. .

Abstract

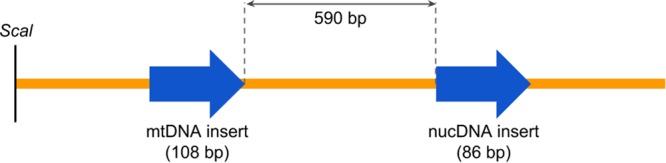
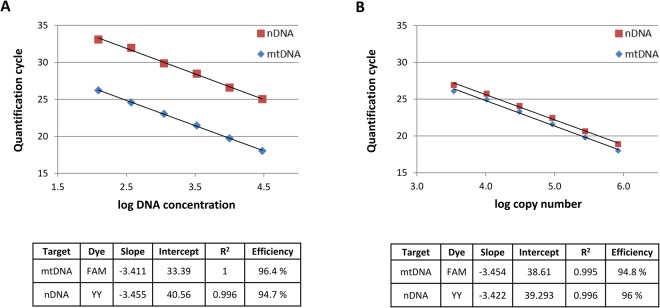
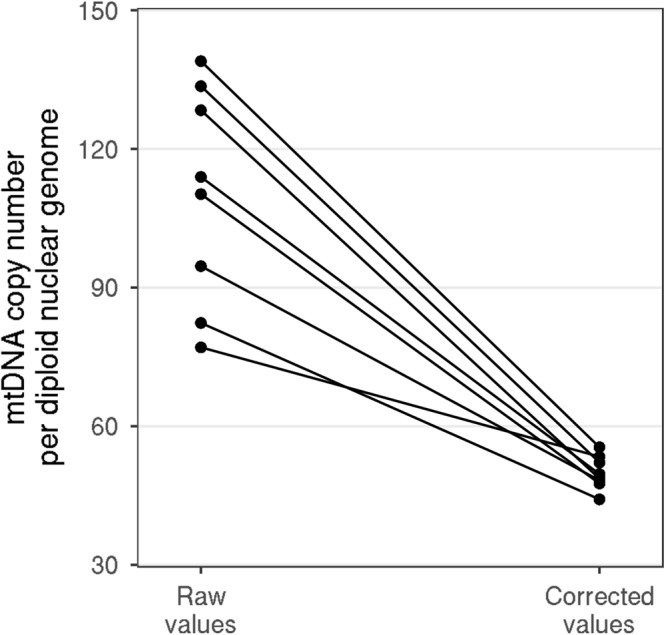
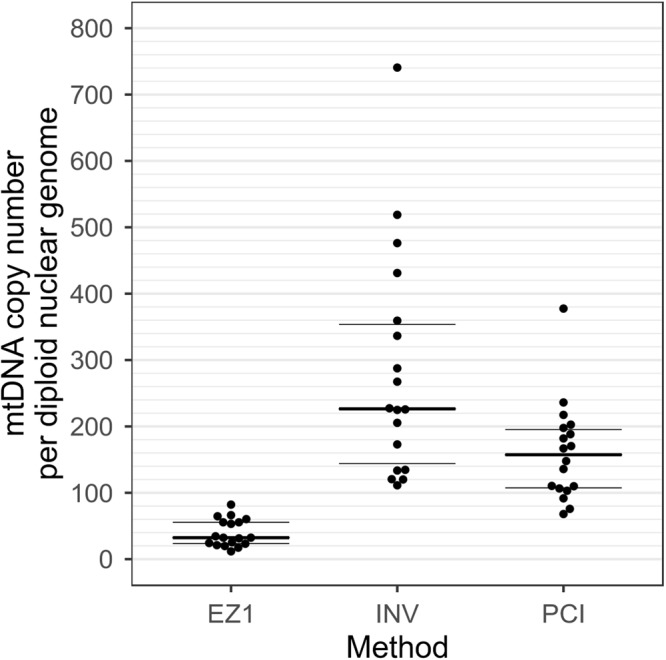
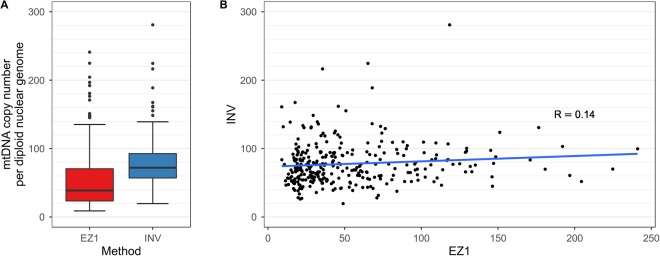
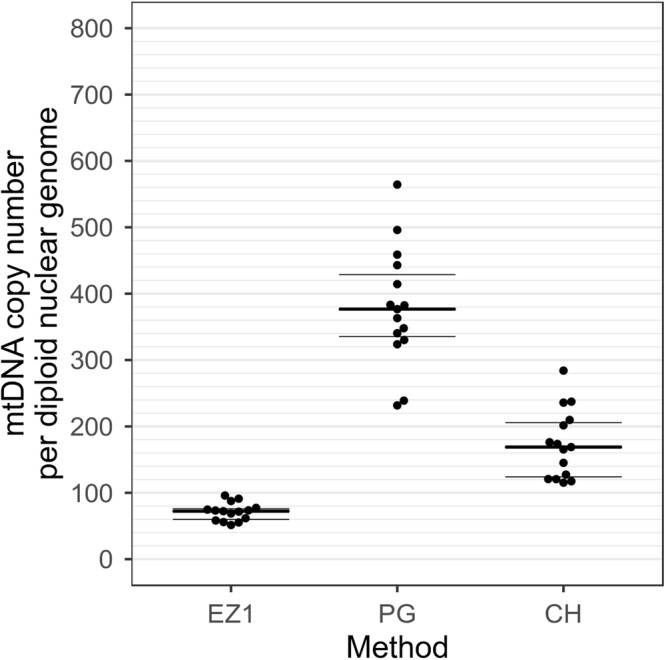
Alterations of mitochondrial DNA (mtDNA) copy number have been associated with a wide variety of phenotypes and diseases. Unfortunately, the literature provides scarce methodical information about duplex targeting of nuclear and mtDNA that meets the quality criteria for qPCR. Therefore, we established a method for mtDNA copy number quantification using a quantitative PCR assay that allows for simultaneous targeting of a single copy nuclear gene (beta-2-microglobulin) and the t-RNALeu gene on the mtDNA. We include a plasmid containing both targets in order to normalize against differences in emission intensities of the fluorescent dyes Yakima Yellow and FAM. Applying the plasmid calibrator on an internal control reduced the intra-assay variability from 21% (uncorrected) to 7% (plasmid-corrected). Moreover, we noted that DNA samples isolated with different methods revealed different numbers of mtDNA copies, thus highlighting an important influence of the pre-analytical procedures. In summary, we developed a precise assay for mitochondrial copy number detection relative to nuclear DNA. Our method is applicable to comparative mitochondrial DNA copy number studies since the use of the dual insert plasmid allows correcting for the unequal emission intensities of the different fluorescent labels of the two targets.


Conflict of interest statement

The authors declare no competing interests.

Figures

Figure 1
Figure 1
Scheme of the linearized dual insert plasmid (pGEM-T vector, 3194 bp) showing the inserts of human mtDNA and nuclear DNA.
Figure 2
Figure 2
Standard curve regression of a DNA template (A) and plasmid DNA (B). Quantification cycle (Cq) values on the y-axis and serial 3-fold dilution of the DNA template (A) and plasmid DNA (B) on the x-axis assayed in quadruplicate by qPCR. Equation of linear regression, R2 and efficiencies of both targets are described in the tables. Standard curve of the calibrator plasmid (containing both targets in a 1:1 ratio) revealed differences in emission intensities of the fluorescent dyes Yakima Yellow and FAM.
Figure 3
Figure 3
Scatter plots of mtDNA content measurement using standard and inverted labelled probes (A) and with two different probe batches (B). The correlation is strong according to the Spearman’s rho test (Spearman’s r = 0.81, p < 2.2 × 10−16 for inverted vs standard probe, Spearman’s rho = 0.86, p < 2.2 × 10−16 for the two different probe batches).
Figure 4
Figure 4
Positive control data for inter-assay reproducibility. One DNA template was included in each of eight independent experiments running on different days. The mtDNA copy number values reached after the calculation using the standard formula are given on the left side. On the right the copy number values obtained using the plasmid correction model. Uncorrected values showed a higher variability (CV was 21% vs 7% of corrected values).
Figure 5
Figure 5
Beeswarm plot illustrating levels of mtDNA extracted by three different DNA extraction methods. MtDNA copy numbers measured in 18 blood samples extracted by EZ1 DNA Blood 200 µl kit (EZ1), a silica-based method, INVISORB Blood Universal Kit (INV), a salting out method, and phenol-chloroform-isoamyl alcohol extraction (PCI). The mtDNA content extracted by INV and PCI is significantly higher than that extracted with EZ1 (Friedman test p-value = 3.419 × 10−07). MtDNA content is shown on the y-axis. Lines indicate first, second (median) and third quartile.
Figure 6
Figure 6
Box plot (A) and scatter plot analysis (B) illustrating mtDNA content measured in 303 blood sample extracted by two different DNA extraction methods. DNA was extracted by EZ1 DNA Blood 200 µl kit (EZ1) and INVISORB Blood Universal Kit (INV). MtDNA content (as described in the text) is shown on the y-axis. We found only a weak correlation between the two methods (Spearman’s r = 0.14, p = 0.015).
Figure 7
Figure 7
Chart showing mtDNA content measured in 45 identical aliquots obtained from the same blood sample extracted in parallel using three different DNA extraction methods. DNA was extracted using EZ1 DNA Blood 200 µl kit (EZ1), PureGene kit (PG) and Chelex resin (CH). Higher values and considerable variability were detected with the two manual methods (INV 332.1 ± 130.3 and Chelex 206.5 ± 55.2 mtDNA copies, average CV were 27.5% and 24.6% respectively) than in the automated method EZ1 (averaged 63.8 mtDNA copies ±15.7, average CV was 15%). The quantitative mtDNA content is shown on the y-axis.
Figure 8
Figure 8
Time curve showing mtDNA content measured in a blood sample extracted by BioRobot EZ1 Advanced after incubation using 4 different lysis buffers. The buffers used were G2 (included in the EZ1 Tissue kit) and Pierce RIPA Buffer Lyse (Thermo Fisher Scientific, Waltham, MA, USA). Both buffers were used pure and in combination with Proteinase K (PK). The baseline is obtained using the standard EZ1 tissue kit protocol without incubation.

Similar articles

Cited by

References

    1. Fernández-Silva P, Enriquez JA, Montoya J. Replication and Transcription of Mammalian Mitochondrial Dna. Exp. Physiol. 2003;88:41–56. doi: 10.1113/eph8802514. - DOI - PubMed
    1. Clay Montier LL, Deng JJ, Bai Y. Number matters: control of mammalian mitochondrial DNA copy number. J. Genet. Genomics. 2009;36:125–131. doi: 10.1016/S1673-8527(08)60099-5. - DOI - PMC - PubMed
    1. Robin ED, Wong R. Mitochondrial DNA molecules and virtual number of mitochondria per cell in mammalian cells. J. Cell. Physiol. 1988;136:507–513. doi: 10.1002/jcp.1041360316. - DOI - PubMed
    1. Malik AN, Czajka A. Is mitochondrial DNA content a potential biomarker of mitochondrial dysfunction? Mitochondrion. 2013;13:481–492. doi: 10.1016/j.mito.2012.10.011. - DOI - PubMed
    1. Melser S, Lavie J, Bénard G. Mitochondrial degradation and energy metabolism. Biochimica et Biophysica Acta - Molecular Cell Research. 2015;1853:2812–2821. doi: 10.1016/j.bbamcr.2015.05.010. - DOI - PubMed

Publication types

Substances