

Effect of diversity on growth, mortality, and loss of resilience to extreme climate events in a tropical planted forest experiment
- PMID: 30337582
- PMCID: PMC6193960
- DOI: 10.1038/s41598-018-33670-x
Effect of diversity on growth, mortality, and loss of resilience to extreme climate events in a tropical planted forest experiment
Erratum in
-
Author Correction: Effect of diversity on growth, mortality, and loss of resilience to extreme climate events in a tropical planted forest experiment.Sci Rep. 2019 Nov 22;9(1):17712. doi: 10.1038/s41598-019-53618-z. Sci Rep. 2019. PMID: 31758006 Free PMC article.
Abstract
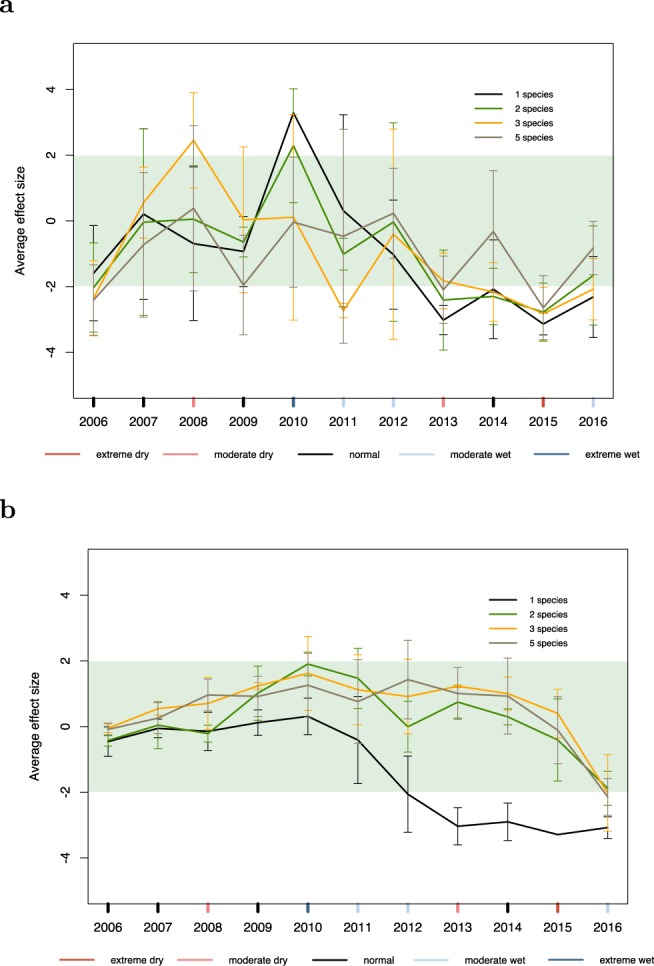
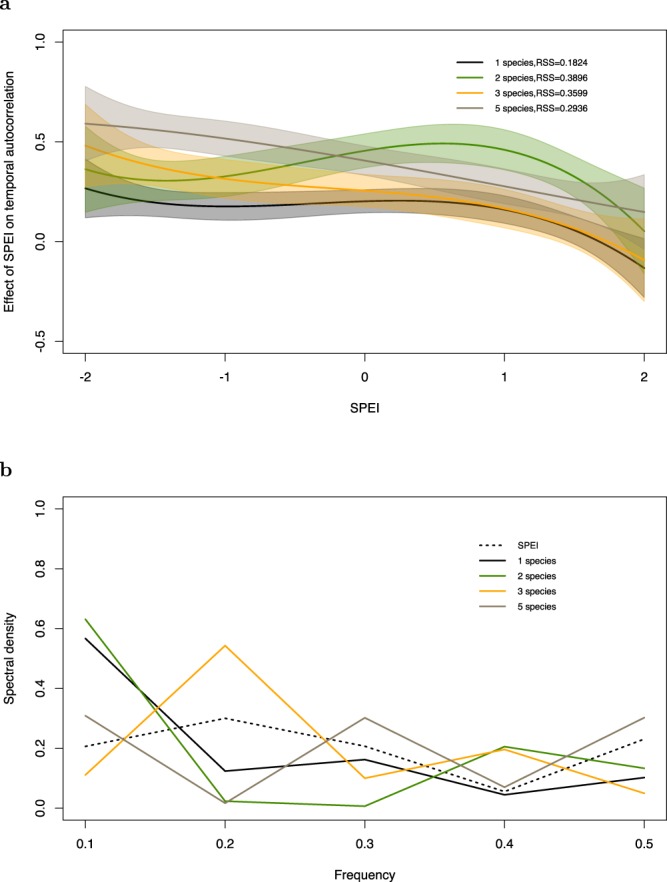
A pressing question is whether biodiversity can buffer ecosystem functioning against extreme climate events. However, biodiversity loss is expected to occur due to climate change with severe impacts to tropical forests. Using data from a ca. 15 year-old tropical planted forest, we construct models based on a bootstrapping procedure to measure growth and mortality among different species richness treatments in response to extreme climate events. In contrast to higher richness mixtures, in one-species plots we find growth is strongly regulated by climate events and we also find increasingly higher mortality during a consecutive four year dry event. Based on these results together with indicators of loss of resilience, we infer an effect of diversity on critical slowing down. Our work generates new methods, concepts, and applications for global change ecology and emphasises the need for research in the area of biodiversity-ecosystem functioning along environmental stress gradients.
Conflict of interest statement
The authors declare no competing interests.
Figures


Similar articles
-
Biodiversity as a solution to mitigate climate change impacts on the functioning of forest ecosystems.Biol Rev Camb Philos Soc. 2018 Feb;93(1):439-456. doi: 10.1111/brv.12351. Epub 2017 Jul 10. Biol Rev Camb Philos Soc. 2018. PMID: 28695682 Review.
-
Anthropogenic impacts on tropical forest biodiversity: a network structure and ecosystem functioning perspective.Philos Trans R Soc Lond B Biol Sci. 2010 Nov 27;365(1558):3709-18. doi: 10.1098/rstb.2010.0273. Philos Trans R Soc Lond B Biol Sci. 2010. PMID: 20980318 Free PMC article.
-
Forest structure in low-diversity tropical forests: a study of Hawaiian wet and dry forests.PLoS One. 2014 Aug 27;9(8):e103268. doi: 10.1371/journal.pone.0103268. eCollection 2014. PLoS One. 2014. PMID: 25162731 Free PMC article.
-
Assessing the growth and climate sensitivity of secondary forests in highly deforested Amazonian landscapes.Ecology. 2020 Mar;101(3):e02954. doi: 10.1002/ecy.2954. Epub 2020 Jan 23. Ecology. 2020. PMID: 31840235
-
Tropical forests and the changing earth system.Philos Trans R Soc Lond B Biol Sci. 2006 Jan 29;361(1465):195-210. doi: 10.1098/rstb.2005.1711. Philos Trans R Soc Lond B Biol Sci. 2006. PMID: 16553317 Free PMC article. Review.
Cited by
-
Functional susceptibility of tropical forests to climate change.Nat Ecol Evol. 2022 Jul;6(7):878-889. doi: 10.1038/s41559-022-01747-6. Epub 2022 May 16. Nat Ecol Evol. 2022. PMID: 35577983
-
Biodiversity and Management as Central Players in the Network of Relationships Underlying Forest Resilience.Glob Chang Biol. 2025 May;31(5):e70196. doi: 10.1111/gcb.70196. Glob Chang Biol. 2025. PMID: 40351244 Free PMC article. Review.
-
Above and belowground community strategies respond to different global change drivers.Sci Rep. 2019 Feb 22;9(1):2540. doi: 10.1038/s41598-019-39033-4. Sci Rep. 2019. PMID: 30796259 Free PMC article.
-
Understanding the value and limits of nature-based solutions to climate change and other global challenges.Philos Trans R Soc Lond B Biol Sci. 2020 Mar 16;375(1794):20190120. doi: 10.1098/rstb.2019.0120. Epub 2020 Jan 27. Philos Trans R Soc Lond B Biol Sci. 2020. PMID: 31983344 Free PMC article. Review.
-
Tree Diversity Increases Carbon Stocks and Fluxes Above-But Not Belowground in a Tropical Forest Experiment.Glob Chang Biol. 2025 Feb;31(2):e70089. doi: 10.1111/gcb.70089. Glob Chang Biol. 2025. PMID: 39996326 Free PMC article.
References
-
- Meehl GA, et al. Trends in extreme weather and climate events: Issues related to modeling extremes in projections of future climate change. Bulletin of the American Meteorological Society. 2000;81:427–436.
-
- Parmesan, C. & Matthews, J. Biological impacts of climate change. In Groom, M., Meffe, G. & Carroll, C. (eds) Principles of conservation biology, 333–360 (Sinauer Associates, Inc, Sunderland, 2006).
-
- Bonan GB. Forests and climate change: Forcings, feedbacks, and the climate benefits of forests. Science. 2008;320:1444–1449. - PubMed
-
- Boisvenue C, Runnings SW. Impacts of climate change on natural forest productivity-evidence since the middle of the 20th century. Global Change Biology. 2006;12:862–882.
-
- Allen CD, et al. A global overview of drought and heat-induced tree mortality reveals emerging climate change risks for forests. Forest Ecology and Management. 2010;259:660–684.
Publication types
MeSH terms
LinkOut - more resources
Full Text Sources
Medical
