MicroRNA induction by copy number gain is associated with poor outcome in squamous cell carcinoma of the lung
- PMID: 30337605
- PMCID: PMC6194131
- DOI: 10.1038/s41598-018-33696-1
MicroRNA induction by copy number gain is associated with poor outcome in squamous cell carcinoma of the lung
Abstract
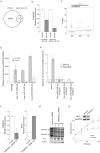
Copy number gains in cancer genomes have been shown to induce oncogene expression and promote carcinogenesis; however, their role in regulating oncogenic microRNAs (onco-miRNAs) remains largely unknown. Our aim was to identify onco-miRNAs induced by copy number gains in human squamous cell carcinoma (Sq) of the lung. We performed a genome-wide screen of onco-miRNAs from 245 Sqs using data sets from RNA-sequencing, comparative genomic hybridization, and the corresponding clinical information from The Cancer Genome Atlas. Among 1001 miRNAs expressed in the samples, 231 were correlated with copy number alternations, with only 11 of these being highly expressed in Sq compared to adenocarcinoma and normal tissues. Notably, miR-296-5p, miR-324-3p, and miR-3928-3p expression was significantly associated with poor prognosis. Multivariate analysis using the Cox proportional hazards model showed that miRNA expression and smoking were independent prognostic factors and were associated with poor prognosis. Furthermore, the three onco-miRNAs inhibited FAM46C to induce MYC expression, promoting proliferation of Sq cells. We found that copy number gains in Sq of the lung induce onco-miRNA expression that is associated with poor prognosis.
Conflict of interest statement
The authors declare no competing interests.
Figures


Similar articles
-
Dual-strand tumor-suppressor microRNA-145 (miR-145-5p and miR-145-3p) coordinately targeted MTDH in lung squamous cell carcinoma.Oncotarget. 2016 Nov 1;7(44):72084-72098. doi: 10.18632/oncotarget.12290. Oncotarget. 2016. PMID: 27765924 Free PMC article.
-
Integrative microRNA and gene profiling data analysis reveals novel biomarkers and mechanisms for lung cancer.Oncotarget. 2016 Feb 23;7(8):8441-54. doi: 10.18632/oncotarget.7264. Oncotarget. 2016. PMID: 26870998 Free PMC article.
-
Differential expression profiles of microRNAs as potential biomarkers for the early diagnosis of lung cancer.Oncol Rep. 2017 Jun;37(6):3543-3553. doi: 10.3892/or.2017.5612. Epub 2017 Apr 28. Oncol Rep. 2017. PMID: 28498428
-
Up-Regulation of miR-21 Expression Predicate Advanced Clinicopathological Features and Poor Prognosis in Patients with Non-Small Cell Lung Cancer.Pathol Oncol Res. 2016 Jan;22(1):161-7. doi: 10.1007/s12253-015-9979-7. Epub 2015 Oct 9. Pathol Oncol Res. 2016. PMID: 26453197
-
Deep sequencing-based microRNA expression signatures in head and neck squamous cell carcinoma: dual strands of pre-miR-150 as antitumor miRNAs.Oncotarget. 2017 May 2;8(18):30288-30304. doi: 10.18632/oncotarget.16327. Oncotarget. 2017. PMID: 28415821 Free PMC article.
Cited by
-
Downregulation of salivary miR-3928 as a potential biomarker in patients with oral squamous cell carcinoma and oral lichen planus.Clin Exp Dent Res. 2024 Apr;10(2):e877. doi: 10.1002/cre2.877. Clin Exp Dent Res. 2024. PMID: 38481355 Free PMC article.
-
CmirC: an integrated database of clustered miRNAs co-localized with copy number variations in cancer.Funct Integr Genomics. 2022 Dec;22(6):1229-1241. doi: 10.1007/s10142-022-00909-w. Epub 2022 Oct 26. Funct Integr Genomics. 2022. PMID: 36287286 Free PMC article.
-
Validation of miR-20a as a Tumor Suppressor Gene in Liver Carcinoma Using Hepatocyte-Specific Hyperactive piggyBac Transposons.Mol Ther Nucleic Acids. 2020 Mar 6;19:1309-1329. doi: 10.1016/j.omtn.2020.01.015. Epub 2020 Jan 22. Mol Ther Nucleic Acids. 2020. PMID: 32160703 Free PMC article.
-
Functions and mechanisms of RNA tailing by metazoan terminal nucleotidyltransferases.Wiley Interdiscip Rev RNA. 2021 Mar;12(2):e1622. doi: 10.1002/wrna.1622. Epub 2020 Jul 22. Wiley Interdiscip Rev RNA. 2021. PMID: 33145994 Free PMC article. Review.
-
Pre-clinical lung squamous cell carcinoma mouse models to identify novel biomarkers and therapeutic interventions.Front Oncol. 2023 Sep 25;13:1260411. doi: 10.3389/fonc.2023.1260411. eCollection 2023. Front Oncol. 2023. PMID: 37817767 Free PMC article. Review.
References
Publication types
MeSH terms
Substances
LinkOut - more resources
Full Text Sources
Medical

