. 2018 Oct 18;8(1):15435.
doi: 10.1038/s41598-018-33900-2.

Using volunteered observations to map human exposure to ticks

Affiliations

Using volunteered observations to map human exposure to ticks

Irene Garcia-Marti et al. Sci Rep. .

Abstract

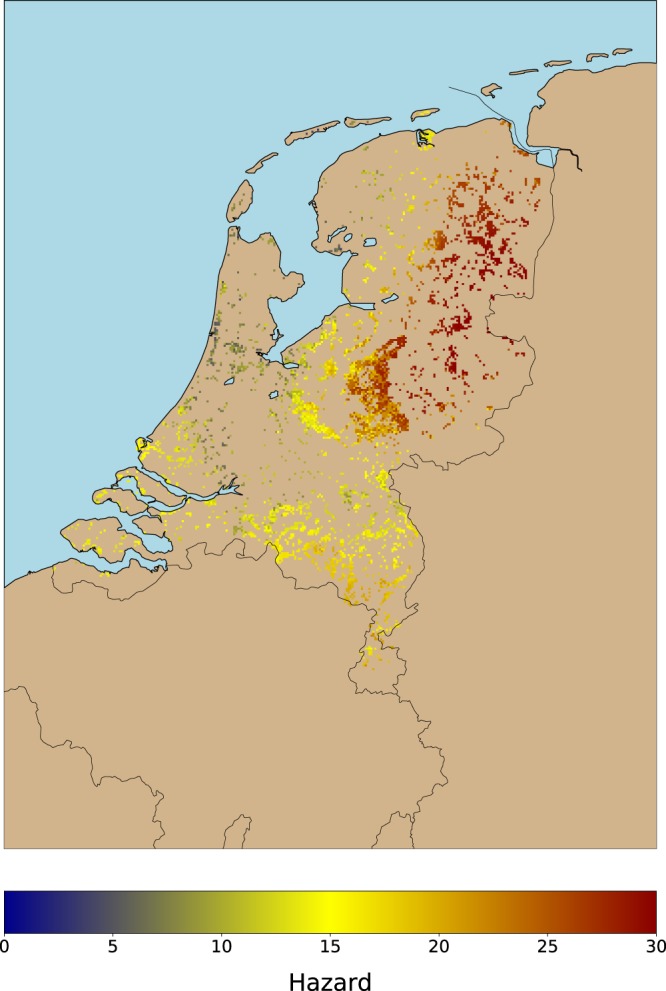
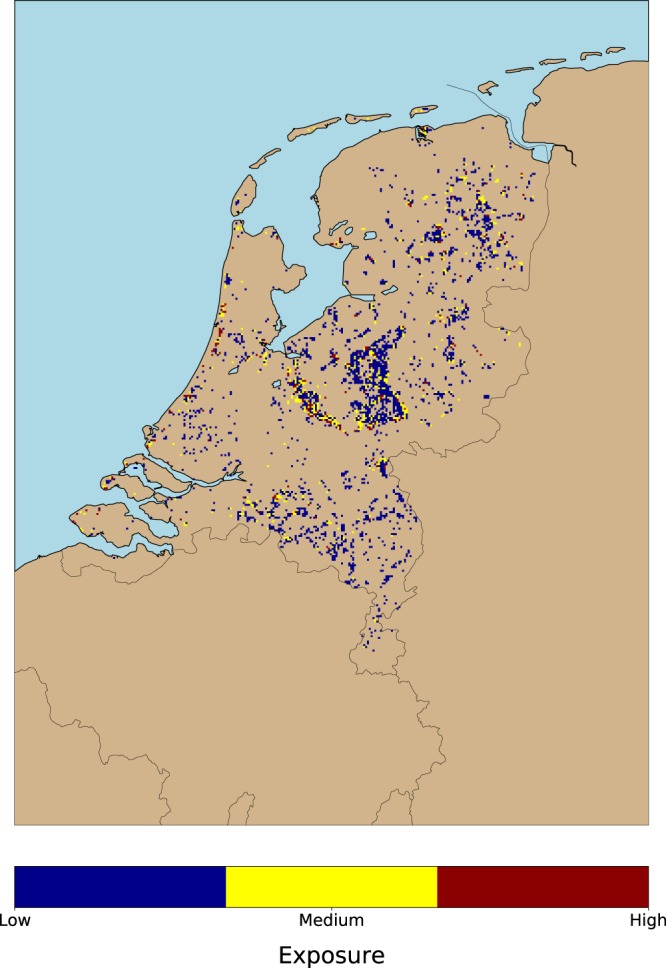
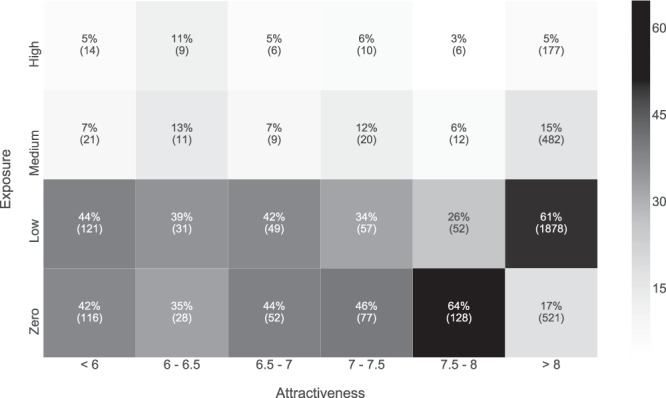
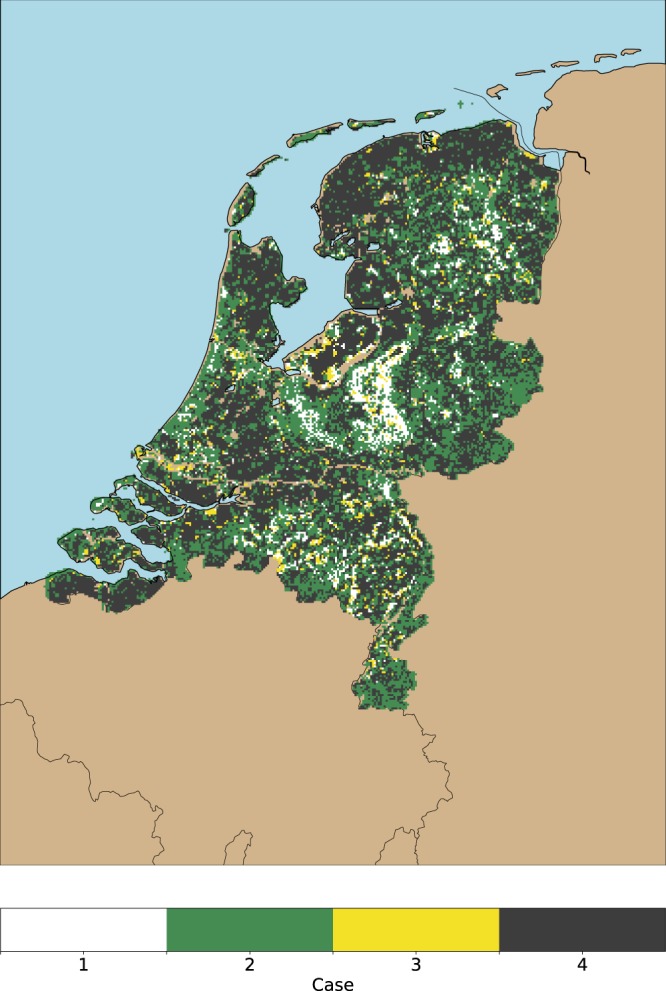
Lyme borreliosis (LB) is the most prevalent tick-borne disease in Europe and its incidence has steadily increased over the last two decades. In the Netherlands alone, more than 20,000 citizens are affected by LB each year. Because of this, two Dutch citizen science projects were started to monitor tick bites. Both projects have collected nearly 50,000 geo-located tick bite reports over the period 2006-2016. The number of tick bite reports per area unit is a proxy of tick bite risk. This risk can also be modelled as the result of the interaction of hazard (e.g. tick activity) and human exposure (e.g. outdoor recreational activities). Multiple studies have focused on quantifying tick hazard. However, quantifying human exposure is a harder task. In this work, we make a first step to map human exposure to ticks by combining tick bite reports with a tick hazard model. Our results show human exposure to tick bites in all forested areas of the Netherlands. This information could facilitate the cooperation between public health specialists and forest managers to create better mitigation campaigns for tick-borne diseases, and it could also support the design of improved plans for ecosystem management.


Conflict of interest statement

The authors declare no competing interests.

Figures

Figure 1
Figure 1
(a) Risk of tick bites (2006–2016) as collected by the NK and TR volunteered projects. The cumulative sum of tick bites reports per 1 km grid cell are used as a proxy of tick bite risk. The image reveals that tick bites are produced throughout the country. However, the reports tend to be clustered around forests (e.g. Veluwe national park, center of the country), or recreational areas (e.g. coastal areas). (b) Locations mentioned along the text. The provinces and the national parks are labeled with capital letters, whereas cities are labeled in lower case.
Figure 2
Figure 2
Hazard (e.g. tick activity) per 1 km grid cell. We used the model developed in to predict daily tick activity for the period 2006–2016. Then, we calculated the maximum mean tick activity for the period to devise this map. The numbers in the legend indicate the average number of active questing ticks per grid cell. The locations of the highest hazard are within the provinces of Groningen, Drenthe, and Overijssel, whereas the lowest hazard levels are located along the coastal areas.
Figure 3
Figure 3
Human exposure to tick bites as a result of combining the maps in the previous two figures. Background color refers to non-forested locations or locations without tick bite reports. The exposure is classified in three categories. Well-known forest edges (e.g. Veluwe national park, Utrechtse Heuvelrug forest) and popular outdoor recreational areas (e.g. coastal areas from Haarlem to Middelburg) are classified as places with a medium and high human exposure. The remaining low exposure class depicts locations less intensely visited by people. Both results suggest that human exposure to tick bites is driven by two types of users (i.e. recreational, residential) as spotted in previous works,, that may require different treatment in the design of public health campaigns targeting a decrease on tick bites occurrence.
Figure 4
Figure 4
Boxplots showing the relationship between exposure and risk (a) and the relationship between exposure and hazard (b). For both figures, the X-axis shows the exposure class, and the Y-axis shows the number of tick bites per grid cells (a) and the tick activity per grid cell (b) respectively. Risk is a skewed distribution (i.e. long-tailed), thus presents low averages per boxplot, and a high number of outliers (reaching the maximum of 353 tick bite reports/cell), whereas hazard is a Gaussian-like distribution and so the averages per boxplot occupy the central part of the distribution. Plot A shows how the risk increases as the exposure increases, and plot B shows how the hazard remains (almost) constant as long as the exposure increases. This means that the risk of getting tick bites is mainly driven by exposure factors, regardless of the amount of hazard (e.g. tick activity) in a location.
Figure 5
Figure 5
Heat map showing the relationship between the exposure classes and the attractiveness classes. The X-axis represents the six classes available in the attractiveness map, and the Y-axis the three classes of the exposure map. Thus, each cell in the heat map represents the number of grid cells belonging to both categories. Note that we applied a per-column normalization of the raw numbers to percentages to ease the interpretation of results, but both values are shown. The first three columns correspond to forest patches that are less attractive for citizens, whereas the last three columns correspond to attractive forested and rural locations. Thus, the first group of columns show a more urban exposure to ticks, whereas the second group of columns show human exposure to ticks in forested locations. The last two columns show an interesting pattern. The fifth column shows that 65% and 26% of the grid cells in the attractiveness class 7.5–8 have a zero and low exposure, respectively. The last column shows that 17% and 61% of the grid cells in the maximum attractiveness class have a zero and low exposure, respectively. This means that within forested locations, citizens have a preference for visiting a subset of them. Absolute numbers show that the majority of the exposure grid cells are concentrated along the column with the maximum attractiveness. This indicates that human recreational intensity is mainly concentrated in very appealing locations.
Figure 6
Figure 6
Visual representation of the four cases described in Table 1. To avoid visual cluttering, the classes in the first case (i.e. R > 0 and H > 0) have been condensed in one category (white). The remaining cases, namely, tick bites reported outside forests (i.e. R > 0 and H = undefined), forests with a low recreational intensity (i.e. R = 0 and H > 0), and locations with zero tick bites reported (i.e. low exposure or low hazard) R = 0 and H = undefined), are shown in the image in light green, yellow, and grey respectively.

References

    1. Hengeveld Geerten M., Schüll Elmar, Trubins Renats, Sallnäs Ola. Forest Landscape Development Scenarios (FoLDS)–A framework for integrating forest models, owners' behaviour and socio-economic developments. Forest Policy and Economics. 2017;85:245–255. doi: 10.1016/j.forpol.2017.03.007. - DOI
    1. Sandifer PA, Sutton-grier AE, Ward BP. Exploring connections among nature, biodiversity, ecosystem services, and human health and well-being: Opportunities to enhance health and biodiversity conservation. Ecosyst. Serv. 2015;12:1–15. doi: 10.1016/j.ecoser.2014.12.007. - DOI
    1. Ehrmann S, et al. Environmental drivers of Ixodes ricinus abundance in forest fragments of rural European landscapes. BMC Ecol. 2017;17:1–31. doi: 10.1186/s12898-017-0141-0. - DOI - PMC - PubMed
    1. Medlock JM, et al. Driving forces for changes in geographical distribution of Ixodes ricinus ticks in Europe. Parasit. Vectors. 2013;6:1. doi: 10.1186/1756-3305-6-1. - DOI - PMC - PubMed
    1. Bleyenheuft C, et al. Epidemiological situation of Lyme borreliosis in Belgium, 2003 to 2012. Arch. Public Heal. 2015;73:1–8. doi: 10.1186/2049-3258-73-1. - DOI - PMC - PubMed