. 2018 Oct 18;8(1):15393.
doi: 10.1038/s41598-018-33828-7.

Surfactant protein D attenuates acute lung and kidney injuries in pneumonia-induced sepsis through modulating apoptosis, inflammation and NF-κB signaling

Affiliations

Surfactant protein D attenuates acute lung and kidney injuries in pneumonia-induced sepsis through modulating apoptosis, inflammation and NF-κB signaling

Juan Du et al. Sci Rep. .

Abstract

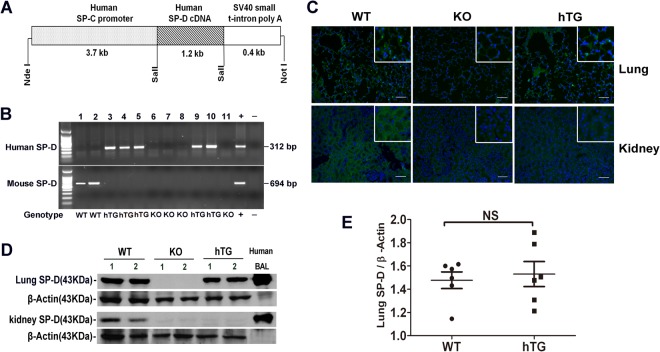
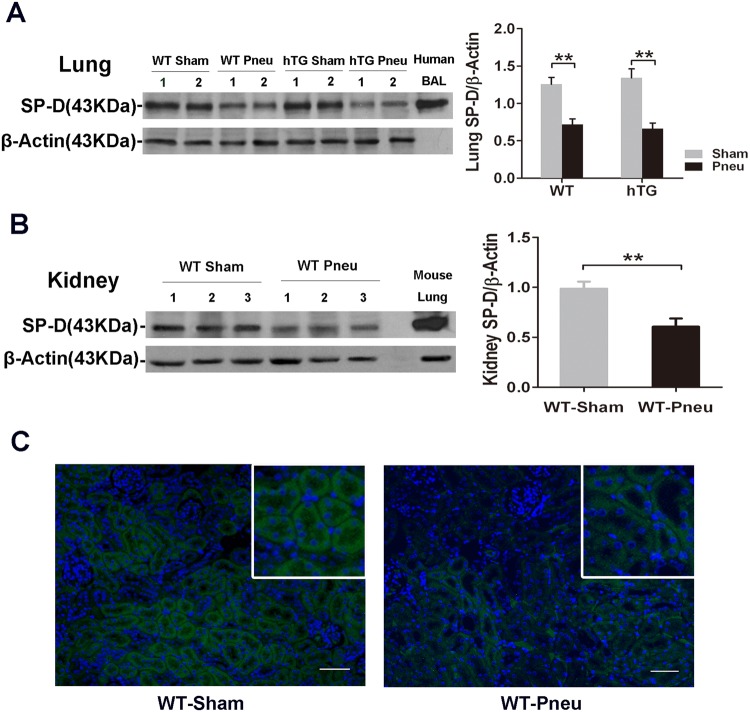
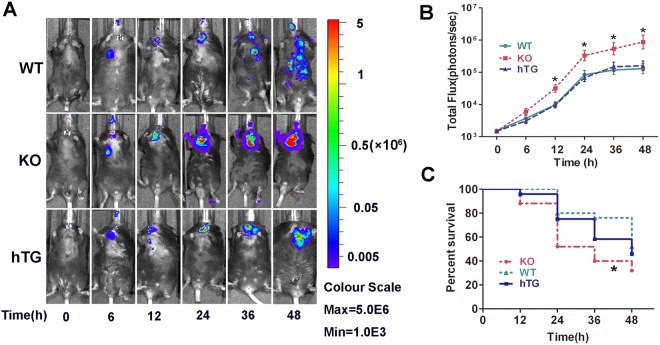
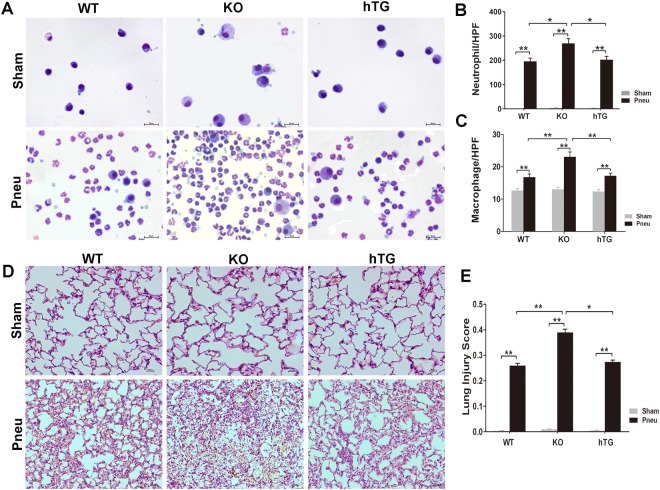
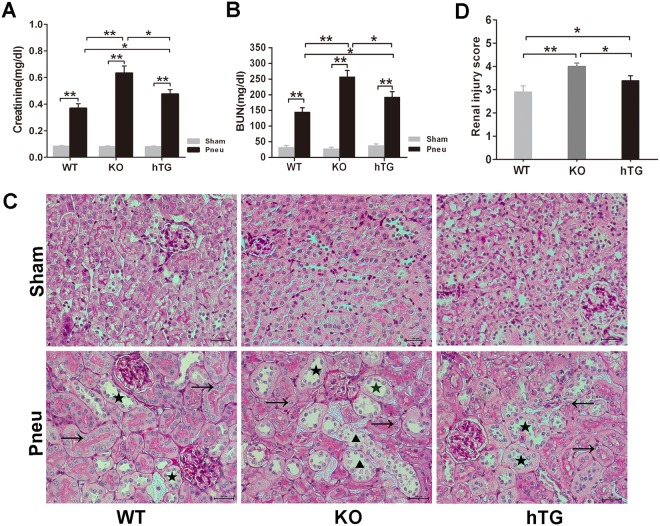
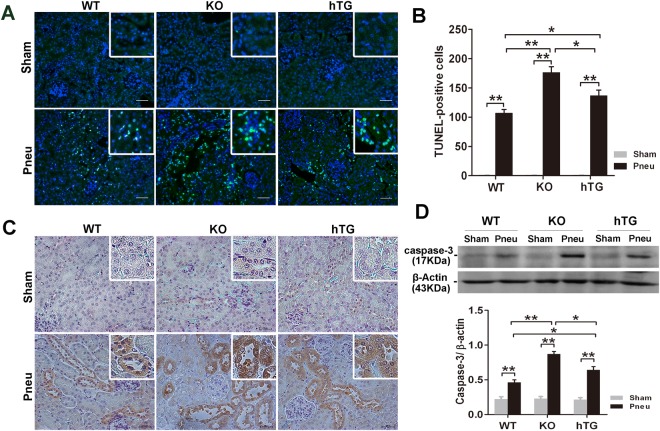
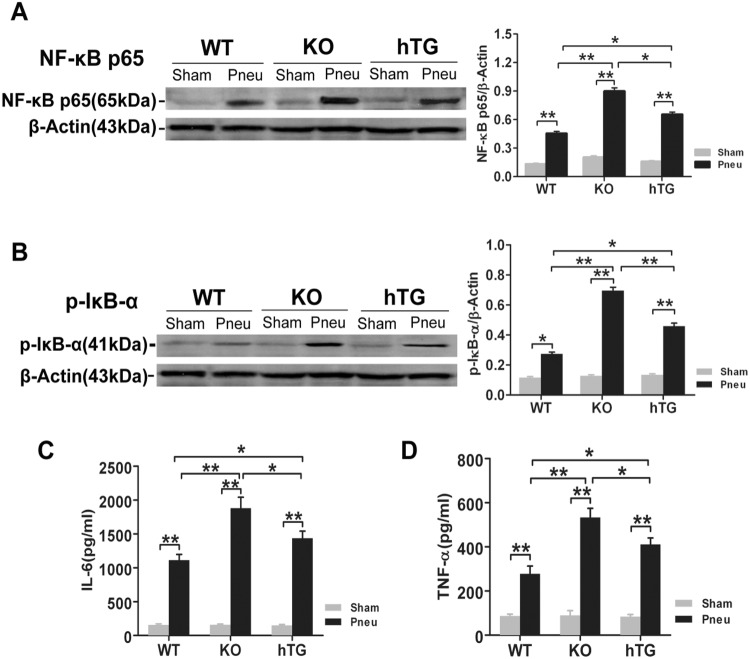
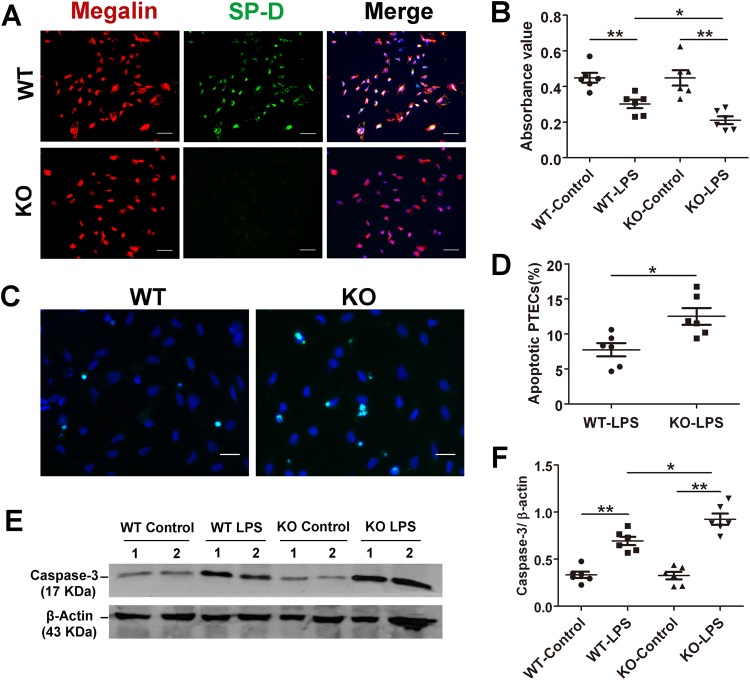
Pneumonia and sepsis are major risk factors for acute kidney injury (AKI). Patients with pneumonia and AKI are at increased risk for morbidity and mortality. Surfactant protein D (SP-D) expressed in lung and kidney plays important roles in innate immunity. However, little is known about the role of organ-specific SP-D in the sepsis. The current study uses wild type (WT), SP-D knockout (KO), and humanized SP-D transgenic (hTG, lung-specific SP-D expression) mice to study organ-specific role of SP-D in pneumonia-induced sepsis. Analyses demonstrated differential lung and kidney injury among three-type mice infected with Pseudomonas aeruginosa. After infection, KO mice showed higher injurious scores in both lung and kidney, and decreased renal function than WT and hTG mice. hTG mice exhibited comparable lung injury but more severe kidney injury compared to WT mice. Increased renal tubular apoptosis, NF-κB activation and proinflammatory cytokines in the kidney of KO mice were found when compared with WT and hTG mice. Furthermore, in vitro primary proximal tubular epithelial cells from KO mice showed more apoptosis with higher level of activated caspase-3 than those from WT mice after LPS treatment. Collectively, SP-D attenuates AKI in the sepsis by modulating renal apoptosis, inflammation and NF-κB signaling.


Conflict of interest statement

The authors declare no competing interests.

Figures

Figure 1
Figure 1
Generation of hTG mice and lung-specific hSP-D expression in hTG mice. (A) The diagram of recombinant DNA fragment used for the generation of hTG mice. The construct consists of a human SP-C promoter, a human SP-D cDNA and a SV40 small t-intron poly A sequence. The human SP-C promoter in the fragment drives alveolar type II cell-specific expression of hSP-D transgene. (B) Genotyping analysis of hTG, KO and WT mice by PCR. Recombinant plasmid was used as positive control and H2O was used instead of DNA template as negative control. The mice were genotyped with primers for hSP-D and mSP-D, respectively. hSP-D PCR product is 312 bp and mSP-D product is 694 bp. hTG mice carry hSP-D gene (No. 3–5, 9, and 10), WT mice have mSP-D (No. 1 and 2) and KO mice with neither hSP-D nor mSP-D (No. 6–8, and 11). (C) Immunofluorescent analysis for SP-D in the lung and kidney from sham WT, KO and hTG mice. SP-D expression (green color for SP-D, blue color for nuclei) was detected in both the lung and kidney of WT mice, in neither the lung nor kidney of KO mice and in the lung but not the kidney of hTG mice. (D) SP-D expression in the lung and kidney tissues from sham WT, KO and hTG mice by Western blotting analysis using an anti-SP-D antibody. Human BALF was used as positive control. SP-D (43 kDa) was expressed in both the lung and kidney of WT mice, in neither the lung nor kidney of KO mice, and in the lung but not kidney of hTG mice. (E) Quantification of SP-D expression by Western blot analysis in the lung of sham WT mice and hTG mice. The data demonstrate similar SP-D level in the lung tissues of sham WT mice and hTG mice. NS: no significance, t-test (n = 6/group).
Figure 2
Figure 2
The effect of bacterial infection on the SP-D expression in the lung and kidney. (A) Western blot analysis of SP-D expression in the lung tissue of WT and hTG mice from sham and infected mice. SP-D expression was significantly reduced at 48 h after infection in both infected WT and hTG mice. No difference was observed between WT and hTG mice with or without infection. *P < 0.05, One-way ANOVA, Newman-Keuls multiple comparison post hoc test (n = 6/group). (B) Western blot analysis of SP-D expression in the kidney of sham and infected WT mice. SP-D expression was significantly lower in infected WT mice vs Sham mice. **P < 0.01, t test (n = 6/group). (C) Immunofluorescence staining for SP-D on representative kidney sections of WT Sham and infected mice. SP-D (green color for SP-D, blue color for nuclei) is predominantly expressed in the proximal tubular epithelial cells. SP-D expression in infected mice was remarkably reduced. Original magnification 200×. Scale bars = 100 μm. Sham = Sham infection, Pneu = Pneumonia.
Figure 3
Figure 3
Mice lacking pulmonary SP-D are more susceptible to bacterial infection. (A) Representative in vivo bioluminescence imaging of bacteria following intratrachial inoculation of P. aeruginosa in WT, KO and hTG mice. After infection, mice were imaged at each time points as listed below. (B) The bioluminescence signal in three groups of infected mice progressively increased and peaked at 48 h after infection. The KO mice showed higher level of bioluminescence than WT and hTG mice at 12 h after infection and beyond, whereas no significant difference between infected WT and hTG mice. *p < 0.05 vs WT or hTG, t test (n = 6/group). (C) The survival curves showed lower survival rate in infected KO mice compared to infected WT, but no difference between infected hTG mice and infected WT mice. *p < 0.05 vs WT, Log-rank test (n = 25/group).
Figure 4
Figure 4
KO mice showed more severe lung injury in bacterial pneumonia compared to WT and hTG mice. (A) Representative BALF cytology of each group from sham and infected mice. The cell pellets of BALF were mounted on a slide by the cytospin centrifugation. The slides were stained using the Hema-3 Stain Kit. Morphologically normal macrophages with no neutrophils in sham WT mice and in hTG mice were observed. The mildly enlarged macrophages, multinucleated macrophages were observed in KO sham mice. P. aeruginosa infection causes predominant neutrophils in the BALF from three groups of infected mice. Scale bars = 100 μm. Quantification of neutrophils (B) and macrophages (C) in the BALF. Neutrophils and macrophages per slide were counted at ×400 magnification under light microscopy. There was no significant difference between infected WT and hTG mice, but the quantification was significantly higher in infected KO mice compared to infected WT and hTG mice. (D) Representative histological sections of lungs from each group. HE staining indicates normal lung structures in both Sham WT and hTG mice, but occasional slight enlargement of distal airspaces in Sham KO mice. Infection of P. aeruginosa causes severe lung histological damage, including diffuse inflammatory cells infiltration in alveoli and interstitial, proteinaceous debris accumulation and interstitial edema in infected mice. (E) Semi-quantitative histological lung injury score was assessed. There is no significant difference among sham groups. The lung injury score is significantly increased after infection compared to sham mice. There is similar lung injury score between infected WT and hTG mice, but infected KO mice showed higher injury score compared to infected WT and hTG mice. Scale bars = 50 μm; *p < 0.05, **p < 0.01, One-way ANOVA, Newman-Keuls multiple comparison post hoc test (n = 6/group). Sham = Sham infection, Pneu = Pneumonia.
Figure 5
Figure 5
Effects of pulmonary and/or renal SP-D on bacterial pneumonia-induced AKI. The infected mice exhibited AKI by a significant elevation of Scr (A) and BUN (B). The infected hTG mice had significantly higher Scr and BUN than infected WT mice and lower Scr and BUN than infected KO mice. *p < 0.05, **p < 0.01, One-way ANOVA, Newman-Keuls multiple comparison post hoc test (n = 6/group). (C) Renal histology from PAS staining showed normal kidney architecture in all sham groups of mice, suggesting that SP-D deficiency in the kidney did not affect kidney development and formation of normal kidney structure. Bacterial pneumonia-induced AKI were characterized by the presence of vacuolar degeneration of tubular cells (arrows), brush border loss with tubular lumen dilatation (stars) and cast formation (triangles). Magnification 200×. Scale bars = 100 μm. (D) Semi-quantitative analysis demonstrated that renal injury score was significantly higher in infected KO mice compared to infected WT and hTG mice. Furthermore, when compared to infected WT mice, hTG mice had significantly higher renal injury score. *p < 0.05, **p < 0.01, t test (n = 6/group). Sham = Sham infection, Pneu = Pneumonia.
Figure 6
Figure 6
SP-D deficiency increases tubular cell apoptosis and caspase-3 activation in the kidney of bacterial pneumonia. (A) Representative images of TUNEL assay in the kidney of sham and infected mice 48 h after P. aeruginosa infection. The apoptotic cells showed green (blue color for nuclei). A large number of apoptotic cells are observed in the kidneys of all infected mice but not in the Sham mice. Original magnification 200×. Scale bars = 100 μm. (B) Apoptotic cells were quantified by counting apoptotic cells per high power field. The numbers of TUNEL-positive cells in the kidney of infected KO and hTG mice are larger than that of infected WT mice. Infected KO mice exhibit more apoptotic cells than hTG mice. *p < 0.05, **p < 0.01, One-way ANOVA, Newman-Keuls multiple comparison post hoc test (n = 6/group). (C) IHC assay for cleaved caspase-3 in the kidneys from Sham and infected mice. The positive staining of activated caspase-3 was characterized by cytoplasmic and perinuclear localization of brown-yellow color reaction. Caspase-3 was significantly activated and expressed on the proximal renal tubules only in infected mice but not in sham mice. Aactivated caspase-3 expression was more prominent in infected KO and hTG mice than infected WT mice. (D) Western blot analysis of cleaved caspase-3 expression in the kidney. Semi-quantitative analysis indicated that the level of activated caspase-3 (17 kDa) was higher in infected KO mice vs hTG or WT mice and in infected hTG vs WT mice. *p < 0.05, **p < 0.01, One-way ANOVA, Newman-Keuls multiple comparison post hoc test (n = 3/group). Sham = Sham infection, Pneu = Pneumonia.
Figure 7
Figure 7
SP-D deficiency increases NF-κB activation and renal inflammation in the kidney. Western blot analysis showed increased NF-κBp65 (A) and p-I-κB α (B) expression in the kidney of infected mice compared to sham mice, indicating increased inflammatory NF-κB signaling activation the in the kidney of infected mice. Quantitative analysis indicated that the levels of NF-κBp65 and p-I-κB α in the kidney of infected mice significantly differ with an order (KO > hTG > WT), suggesting that lack of pulmonary and/or renal SP-D increases the level NF-κB activation in the kidney of bacterial pneumonia. *p < 0.05, **p < 0.01, One-way ANOVA, Newman-Keuls multiple comparison post hoc test (n = 3/group). Pro-inflammatory cytokines were determined by ELISA assay for IL-6 (C) and TNF-α (D) in the kidney of infected WT, KO and hTG mice. The results showed significantly elevated levels of IL-6 and TNF-α in all infected mice with an order (KO > hTG > WT) at 48 h after infection, suggesting inhibitory effects of SP-D in the renal inflammation of pneumonia-induced AKI. *p < 0.05, **p < 0.01, One-way ANOVA, Newman-Keuls multiple comparison post hoc test (n = 6/group). Sham = Sham infection, Pneu = Pneumonia.
Figure 8
Figure 8
Primary proximal tubular epithelial cells (PTECs) from KO mice increase apoptosis and apoptosis-related caspase-3 expression after LPS treatment compared to those from WT mice. (A) PTECs from WT and KO mice were isolated and identified as described in the section of Method. More than 95% of the isolated cells from WT mice showed both megalin (red color; a biomarker of tubular epithelial cell) and SP-D positive (green color), but the cells from KO mice showed only megalin positive but SP-D negative as expected. Magnification 200×. Scale bars = 100 μm. (B) PTECs viability after 24 h treatment of serum-free medium with or without 10 µg/ml LPS. An exposure to LPS showed decreased cell viability compared control without LPS treatment. Treated PTECs from KO mice had lower viability than treated PTECs from WT mice. *p < 0.05, **p < 0.01, One-way ANOVA, Newman-Keuls multiple comparison post hoc test (n = 6). (C) Representative image of apoptotic PTECs (light green for apoptotic cells, blue color for nuclei) detected by TUNEL in WT and KO group after 24 hours treatment of 10 µg/ml LPS. Original magnification 400×. Scale bars = 100 μm. (D) Quantitative analysis of TUNEL positive PTECs showed that the percentage of apoptotic cells (apoptotic cells/total number of cells per ×400 field) was higher in the KO group than WT group after LPS treatment. *p < 0.05, **p < 0.01, t test (n = 6/group). Western blot analysis (E) and semi-quantitative analysis (F) of cleaved caspase-3 (17 Kda) expression in the PTECs showed increased expression of 17-KDa caspase-3 in the LPS treated cells with comparison of untreated cells, and the level of cleaved caspased-3 was higher in treated PTECs from KO mice vs. WT mice. *p < 0.05, **p < 0.01, One-way ANOVA, Newman-Keuls multiple comparison post hoc test (n = 6/group).

Similar articles

Cited by

References

    1. Hoste EA, et al. Epidemiology of acute kidney injury in critically ill patients: the multinational AKI-EPI study. Intensive Care Med. 2015;41:1411–1423. doi: 10.1007/s00134-015-3934-7. - DOI - PubMed
    1. Mehta RL, Pascual MT, Gruta CG, Zhuang S, Chertow GM. Refining predictive models in critically ill patients with acute renal failure. J Am Soc Nephrol. 2002;13:1350–1357. doi: 10.1097/01.ASN.0000014692.19351.52. - DOI - PubMed
    1. Murugan R, et al. Acute kidney injury in non-severe pneumonia is associated with an increased immune response and lower survival. Kidney Int. 2010;77:527–535. doi: 10.1038/ki.2009.502. - DOI - PMC - PubMed
    1. Darmon M, et al. Acute respiratory distress syndrome and risk of AKI among critically ill patients. Clin J Am Soc Nephrol. 2014;9:1347–1353. doi: 10.2215/CJN.08300813. - DOI - PMC - PubMed
    1. Vieira JM, Jr., et al. Effect of acute kidney injury on weaning from mechanical ventilation in critically ill patients. Crit Care Med. 2007;35:184–191. doi: 10.1097/01.CCM.0000249828.81705.65. - DOI - PubMed

Publication types

MeSH terms

Substances