

Assessing the Aerial Interconnectivity of Distant Reservoirs of Sclerotinia sclerotiorum
- PMID: 30337908
- PMCID: PMC6178138
- DOI: 10.3389/fmicb.2018.02257
Assessing the Aerial Interconnectivity of Distant Reservoirs of Sclerotinia sclerotiorum
Abstract
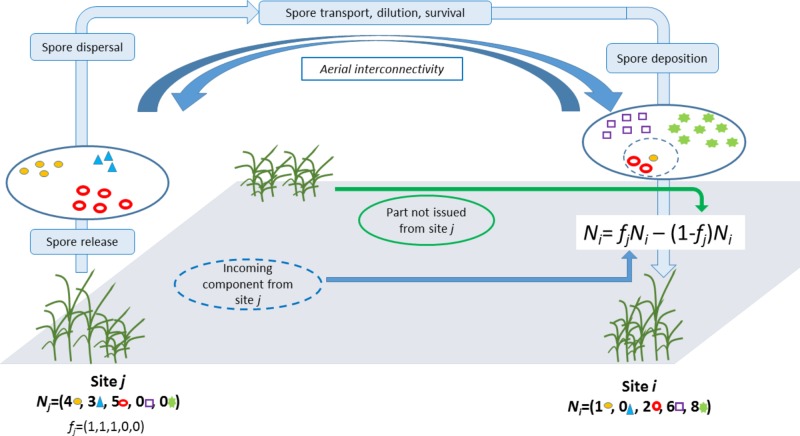
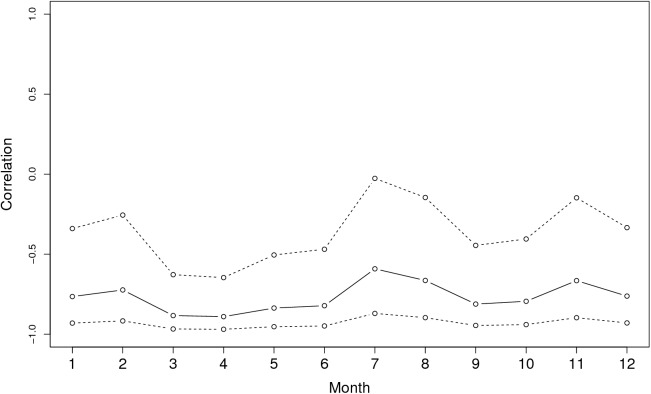
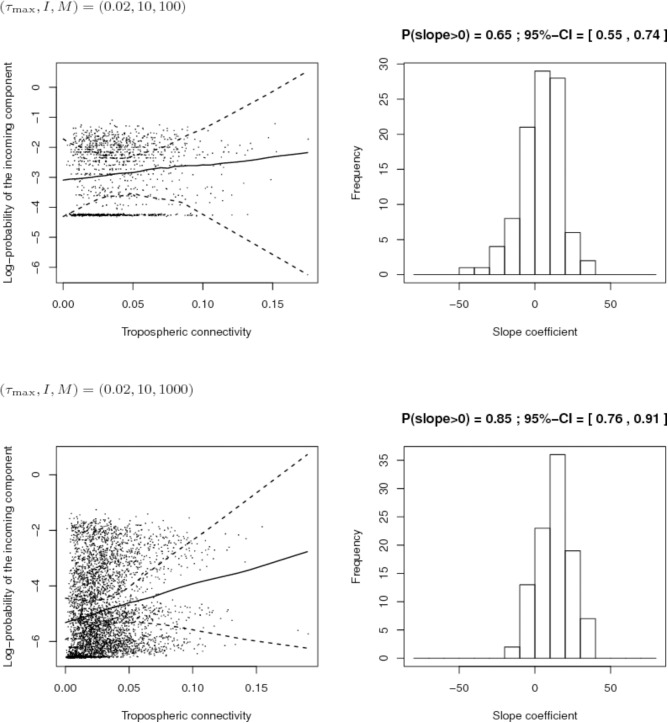
Many phytopathogenic fungi are disseminated as spores via the atmosphere from short to long distances. The distance of dissemination determines the extent to which plant diseases can spread and novel genotypes of pathogens can invade new territories. Predictive tools including models that forecast the arrival of spores in areas where susceptible crops are grown can help to more efficiently manage crop health. However, such models are difficult to establish for fungi with broad host ranges because sources of inoculum cannot be readily identified. Sclerotinia sclerotiorum, the pandemic agent of white mold disease, can attack >400 plant species including economically important crops. Monitoring airborne inoculum of S. sclerotiorum in several French cropping areas has shown that viable ascospores are present in the air almost all the time, even when no susceptible crops are nearby. This raises the hypothesis of a distant origin of airborne inoculum. The objective of the present study was to determine the interconnectivity of reservoirs of S. sclerotiorum from distant regions based on networks of air mass movement. Viable airborne inoculum of S. sclerotiorum was collected in four distinct regions of France and 498 strains were genotyped with 16 specific microsatellite markers and compared among the regions. Air mass movements were inferred using the HYSPLIT model and archived meteorological data from the global data assimilation system (GDAS). The results show that up to 700 km could separate collection sites that shared the same haplotypes. There was low or no genetic differentiation between strains collected from the four sites. The rate of aerial connectivity between two sites varied according to the direction considered. The results also show that the aerial connectivity between sites is a better indicator of the probability of the incoming component (PIC) of inoculum at a given site from another one than is geographic distance. We identified the links between specific sites in the trajectories of air masses and we quantified the frequencies at which the directional links occurred as a proof-of-concept for an operational method to assess the arrival of airborne inoculum in a given area from distant origins.
Keywords: air-mass movement; airborne inoculum; contact network; polyphagous fungi; risk forecasting.
Figures
References
-
- Arnaud-Haond S., Belkhir K. (2007). GENCLONE: a computer program to analyse genotypic data, test for clonality and describe spatial clonal organization. Mol. Ecol. Notes 7 15–17. 10.1111/j.1471-8286.2006.01522.x - DOI
-
- Aylor D. E., Taylor G. S., Raynor G. S. (1982). Long-range transport of tobacco blue mold spores. Agric. Meteorol. 27 217–232. 10.1016/0002-1571(82)90007-3 - DOI
-
- Belkhir K., Borsa P., Chikhi L., Raufaste N., Bonhomme F. (1996–2004). Genetix 4.05, Logiciel Sous Windows TM Pour la Génétique Des populations. Laboratoire Génome, Populations, Interactions, CNRS UMR 5171. Montpellier: Université de Montpellier.
-
- Boland G. J., Hall R. (1994). Index of plant host of Sclerotinia sclerotiorum. Can. J. Plant Pathol. 16 93–108. 10.1080/07060669409500766 - DOI
LinkOut - more resources
Full Text Sources
Molecular Biology Databases