. 2018 Sep 25:9:2151.
doi: 10.3389/fimmu.2018.02151. eCollection 2018.

STAT2 Signaling Regulates Macrophage Phenotype During Influenza and Bacterial Super-Infection

Affiliations

STAT2 Signaling Regulates Macrophage Phenotype During Influenza and Bacterial Super-Infection

Radha Gopal et al. Front Immunol. .

Abstract

Influenza is a common respiratory virus that infects between 5 and 20% of the US population and results in 30,000 deaths annually. A primary cause of influenza-associated death is secondary bacterial pneumonia. We have previously shown that influenza induces type I interferon (IFN)-mediated inhibition of Type 17 immune responses, resulting in exacerbation of bacterial burden during influenza and Staphylococcus aureus super-infection. In this study, we investigated the role of STAT2 signaling during influenza and influenza-bacterial super-infection in mice. Influenza-infected STAT2-/- mice had increased morbidity, viral burden, and inflammation when compared to wild-type mice. Despite an exaggerated inflammatory response to influenza infection, we found increased bacterial control and survival in STAT2 deficient mice during influenza-MRSA super-infection compared to controls. Further, we found that increased bacterial clearance during influenza-MRSA super-infection is not due to rescue of Type 17 immunity. Absence of STAT2 was associated with increased accumulation of M1, M2 and M1/M2 co-expressing macrophages during influenza-bacterial super-infection. Neutralization of IFNγ (M1) and/or Arginase 1 (M2) impaired bacterial clearance in Stat2-/- mice during super-infection, demonstrating that pulmonary macrophages expressing a mixed M1/M2 phenotype promote bacterial control during influenza-bacterial super-infection. Together, these results suggest that the STAT2 signaling is involved in suppressing macrophage activation and bacterial control during influenza-bacterial super-infection. Further, these studies reveal novel mechanistic insight into the roles of macrophage subpopulations in pulmonary host defense.

Keywords: STAT2; Staphylococcus aureus; influenza; lung; macrophages; pneumonia; super-infection.


Figures

Figure 1
Figure 1
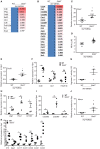
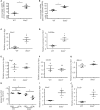
Stat2−/− mice have increased susceptibility to influenza infection. (A) WT, Stat2−/− male 6–8 weeks mice were infected with 100 PFU of influenza, percentage weight loss on day 6 of influenza infection, N = 22–24 per group. (B) Viral burden was measured by influenza M protein expression 6 days following influenza infection in whole lung, N = 6 per group. (C) Weight loss during 35 days following influenza infection, N = 8 per group. (D) Percentage survival following influenza infection in females, N = 8 per group. (E) BAL samples collected on day 6 following influenza infection from mice lungs, cytospin the cells and differential counts were made N = 10–12 per group. Right upper lung lobes were homogenized in PBS, (F) IFNβ levels were measured in BAL samples by using ELISA, N = 4 per group. (G) IL-1α, IL-1β, TNFα, IL-6, and IL-12p40, (H) IL-17A, IFNγ, IL-4, and IL-5 (I) CXCL1, and GCSF levels were measured by Luminex assay, N = 4 per group. Representative data shown from 3 or more experiments are shown (J) On day 6 post infection, lungs were fixed in 10% formalin, embedded in paraffin, stained with H&E, lung perivascular areas (arrows) were scored. (K) Representative histology pictures are shown. Original magnification for H&E sections × 100. Data are represented as mean±SEM, two tailed Student's t-test, *p < 0.05, **p < 0.01, ***p < 0.001, ns, not significant.
Figure 2
Figure 2
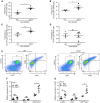
Stat2−/− are rescued from impaired bacterial clearance from the lung following influenza infection. (A) WT or Stat2−/− mice were infected with 100 PFU of influenza for 6 days then challenged with 5 × 10⁷ cfu of MRSA for one additional day. Right upper lung lobes were homogenized in PBS and bacterial burden was determined. N = 12–13 per group. (B) Adult female mice were infected with 66 PFU influenza A PR/8/H1N1 followed by challenge with 2 × 10⁸ CFU MRSA and the survival was determined, N = 7–8 per group. (C) BAL samples collected from co-infected B6 and Stat2−/− mice, cytospin the cells and differential counts were made, N = 11–13 per group. Right Upper lung lobes were homogenized in PBS, and (D) IL-1α, IL-1β, TNFα, IL-6, IL-12p40, (E) IL-17A, IFNγ, IL-4, IL-5 (F) CXCL1, and GCSF levels were measured by luminex assay, N = 4 per group. Representative data shown from three or more experiments. Lungs were fixed in 10% formalin, embedded in paraffin, (G) perivascular areas (arrows) were scored in formalin fixed lungs by staining with H&E (H) representative figures are shown, N = 4 per group. Original magnification for H&E sections × 100. Data are represented as mean±SEM. Data analyzed using 2-tailed Student's t-test or One way ANOVA followed by Bonferroni test for multiple comparisons, *p < 0.05, **p < 0.01, ns, not significant.
Figure 3
Figure 3
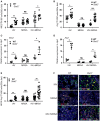
M1 and M2 macrophages are associated with increased bacterial clearance in Stat2−/− during influenza-MRSA super-infection. WT or Stat2−/− mice were infected with 100 PFU of influenza for 6 days then challenged with 5 × 10⁷ cfu of MRSA for one additional day. Gene expression analyses were measured in lung by RNAseq analysis. Heat-map representing RNA abundance associated with M1 (A) and M2 (B) macrophages from WT and Stat2−/− mice, N = 4 per group. (C) Nos2, (D) Nitrite, (E) Cxcl9, (F) Ccl8, Ido1, Tnfsf13b were analyzed by RT-PCR, N = 4 per group. (G) Arginase-1 activity was determined from BAL samples from both WT and Stat2−/− mice infected with influenza and MRSA super-infection, N = 4 per group. (H) Arg1, Fizz1, and Chi3l3, (I) Cd209d, Cd209e and Mrc2 (J) Marco mRNA expression levels were determined by RT-PCR, N = 3–4 per group. (K) Il13 and Saa1, Ccl17, Ccl19, Ccl20, Ccl22, and Ccl24 mRNA expression levels were determined by RT-PCR, N = 4 per group. Representative data shown from three or more experiments. Data are represented as mean±SEM. Data analyzed using 2-tailed Student's t-test, *p < 0.05, **p < 0.01, ns, not significant.
Figure 4
Figure 4
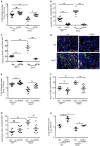
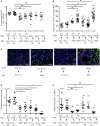
Increased frequency of M1/M2 macrophages in Stat2−/− during influenza-MRSA super-infection. WT or Stat2−/− mice were infected with 100 PFU of influenza for 6 days then challenged with 5 × 10⁷ cfu of MRSA for one additional day. (A) Frequency of CD11b+Ly6C+ cells, (B) CD11b+Ly6C+CD80+ cells, (C) CD11b+Ly6C+MGL+ cells (D) CD11b+Ly6C+CD80+MGL+ cells from lungs were determined from influenza and MRSA super infection by flow cytometry, N = 4 per group. Double positive CD11b+Ly6C+ cells were gated for CD80 and MGL to identify the CD11b+Ly6C+CD80+, CD11b+Ly6C+MGL+, CD11b+Ly6C+CD80+MGL+ cells. (E) The representative figures were shown. CD80+, MGL+, CD80+MGL+ cells were sorted from the lung using FACS and Arg1 (F) NOS2 (G) RNA expression was analyzed using RT-PCR. N = 4 per group. Data analyzed using 2-tailed Student's t-test, *p < 0.05, **p < 0.01, ns, not significant.
Figure 5
Figure 5
Increased M1 and M2 macrophage expression in Stat2−/− is dependent on influenza but not MRSA infection. WT or Stat2−/− mice were infected with 100 PFU of influenza for 6 days or 5 × 10⁷ cfu of MRSA for one day or super-infection as described in methods. (A) iNOS+F4/80+, N = 11–16 (B) Arg1+F4/80+ producing cells were determined from lungs by IHC, N = 11–16. (C) Nos2, (D) Arg1 gene expression was analyzed from lungs by RT-PCR, N = 4 per group. (E) iNOS+Arg1+F4/80+ producing cells were determined from lung by immunohistochemistry, N = 11–32 per group. (F) Representative figures, × 200 magnification fields are shown. Data are represented as mean±SEM. Data analyzed using two-tailed Student's t-test, *p < 0.05, **p < 0.01, ***p < 0.001, ns, not significant.
Figure 6
Figure 6
M1/M2 co-expressing macrophages are required for increased bacterial clearance in Stat2−/− during influenza-MRSA super-infection. WT or Stat2−/− mice were infected with 100 PFU of influenza for 6 days then challenged with 5 × 10⁷ cfu of MRSA for one additional day. Mice were treated with 300 μg of anti-IFNγ antibodies or 300 μg of rat IgG isotype controls as described in methods. (A) Bacterial burden was measured, N = 7–8 per group, (B) iNOS+F4/80+ producing cells, N = 12 per group (C) iNOS+Arg1+F4/80+ producing cells, N = 3–7 per group (D) were determined by IHC, representative figures x200 magnification fields are shown. WT or Stat2−/− mice were infected with 100 PFU of influenza for 6 days then challenged with 5 × 10⁷ cfu of MRSA for one additional day. Mice were treated with Vehicle (DMSO) or N-hydroxy-nor-L-arginine (nor-NOHA) as described in methods (E) Bacterial burden, N = 8 per group, (F) Arg+F4/80+ cells, N = 6–10 per group (G) iNOS+Arg+F4/80+ producing cells were determined, N = 7–10 per group. Representative pictures from two experiments are shown. (G) WT or Stat2−/− mice were infected with 100 PFU of influenza for 6 days then challenged with 5 × 10⁷ cfu of MRSA for one additional day. Mice were treated with 300 μg of anti-IFNγ antibodies and N-hydroxy-nor-L-arginine (nor-NOHA) or vehicle as described in methods (H) Bacterial burden was measured, N = 4 per group, Data are represented as mean±SEM. Data analyzed using 2-tailed Student's t-test or One way ANOVA followed by Bonferroni test for multiple comparisons, *p < 0.05, **p < 0.01, ***p < 0.001, ns, not significant.
Figure 7
Figure 7
Increased bacterial uptake and killing efficiency in BMDMs from Stat2−/− mice BMDMs were generated and infected with FITC or Alex-647-labeled MRSA (10 MOI) for 30 min, washed, fixed with 1% formaldehyde and the number of FITC+ (A) or Alex-647+ (B) BMDMs were determined by Flow cytometry. (C) Mrc2 and (D) Cd209e, (E) Arg1, (F) Chi3l3, (G) Marco gene expression levels were measured by RT-PCR. (H) BMDMs were generated, treated with recombinant IFNγ (10 μg/ml) for 24 h, and infected with MRSA (10 MOI) and bacterial killing was determined. (I) Nos2 and (J) Cxcl9 gene expression levels were measured from naïve BMDMs, N = triplicates per treatment. Representative pictures from two experiments are shown. Data are represented as mean±SEM. Data analyzed using 2-tailed Student's t-test, *p < 0.05, ns, not significant.
Figure 8
Figure 8
Increased bacterial control in cells from hematopoietic or non-hematopoietic compartments of Stat2−/− mice. WT BMC (Thy1.1 host, Thy 1.2 BM or Thy 1.2 host, Thy 1.1 BM), Stat2−/− BMC (Stat2−/− host, Stat2−/− BM), Hematopoietic Stat2−/− BMC mice (Thy 1.1 or Thy 1.2 host, Stat2−/− BM), non- hematopoietic Stat2−/− BMC (Stat2−/− host, Thy 1.1 or Thy 1.2 BM) were generated as described in methods. These mice were infected with 100 PFU of influenza for 6 days then challenged with 5 × 10⁷ cfu of MRSA for one additional day. (A) Mice were sacrificed and right upper lung lobes were homogenized in PBS and bacterial burden was measured. (B) iNOS+Arg1+F4/80+ producing cells were determined from lung by immunohistochemistry, N = 6–19 per group. (C) Representative figures, × 200 magnification fields are shown. (D) Mx1, (E) Ccl12 mRNA expression was measured, N = 6–9 per group. Data are represented as mean±SEM. Data analyzed using One way ANOVA followed by Bonferroni test for multiple comparisons, *p < 0.05, **p < 0.01, ns, not significant.

References

    1. Simonsen L, Clarke MJ, Williamson GD, Stroup DF, Arden NH, Schonberger LB. The impact of influenza epidemics on mortality: introducing a severity index. Am J Public Health (1997) 87:1944–50. - PMC - PubMed
    1. Iwasaki A, Pillai PS. Innate immunity to influenza virus infection. Nat Rev Immunol. (2014) 14:315–28. 10.1038/nri3665 - DOI - PMC - PubMed
    1. Wu S, Metcalf JP, Wu W. Innate immune response to influenza virus. Curr Opin Infect Dis. (2011) 24:235–40. 10.1097/QCO.0b013e328344c0e3 - DOI - PubMed
    1. Pulendran B, Maddur MS. Innate immune sensing and response to influenza. Curr Top Microbiol Immunol. (2015) 386:23–71. 10.1007/82_2014_405 - DOI - PMC - PubMed
    1. Durbin RK, Kotenko SV, Durbin JE. Interferon induction and function at the mucosal surface. Immunol Rev. (2013) 255:25–39. 10.1111/imr.12101 - DOI - PMC - PubMed

Publication types

MeSH terms

Substances