

Estimating the contribution of studies in network meta-analysis: paths, flows and streams
- PMID: 30338058
- PMCID: PMC6148216
- DOI: 10.12688/f1000research.14770.3
Estimating the contribution of studies in network meta-analysis: paths, flows and streams
Abstract
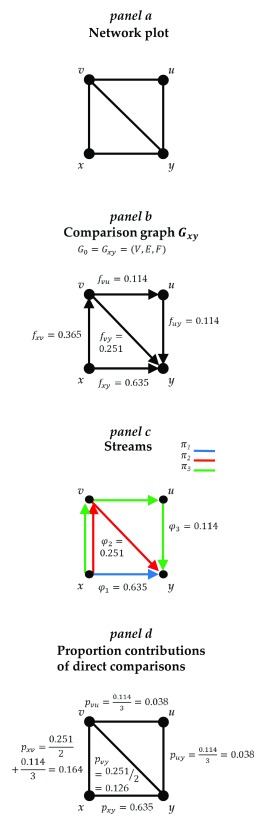
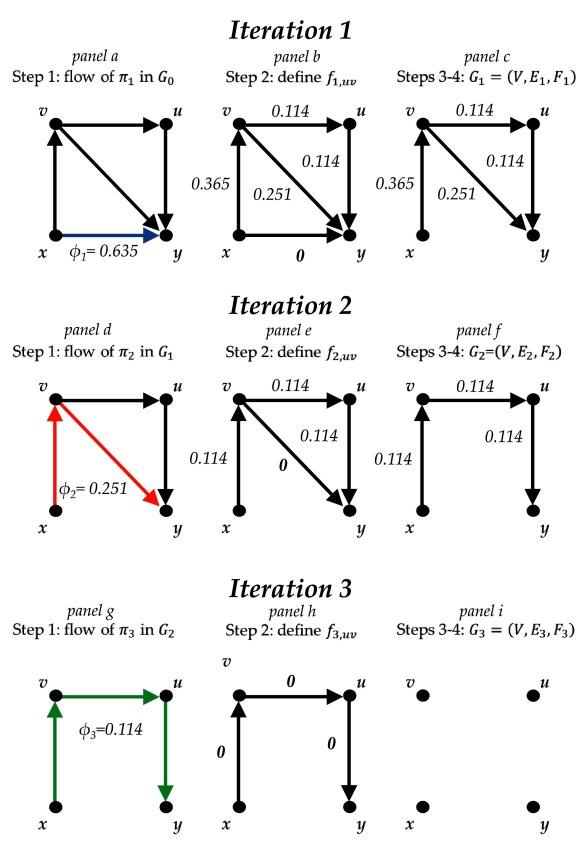
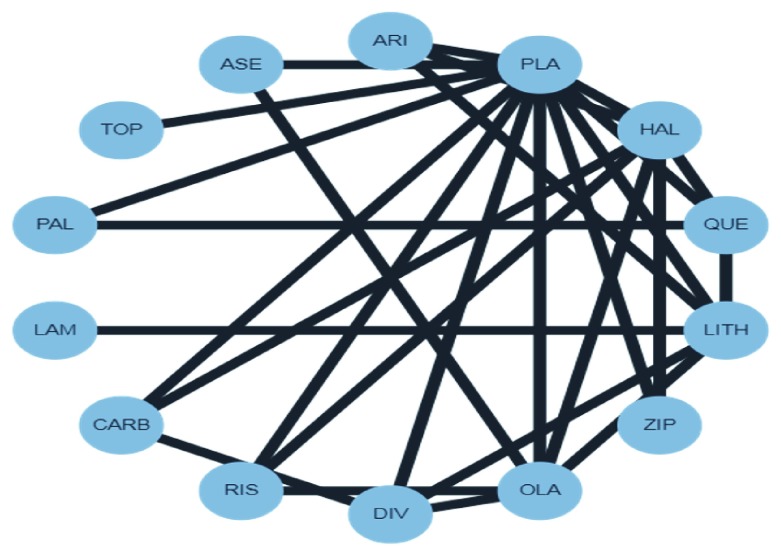
In network meta-analysis, it is important to assess the influence of the limitations or other characteristics of individual studies on the estimates obtained from the network. The proportion contribution matrix, which shows how much each direct treatment effect contributes to each treatment effect estimate from network meta-analysis, is crucial in this context. We use ideas from graph theory to derive the proportion that is contributed by each direct treatment effect. We start with the 'projection' matrix in a two-step network meta-analysis model, called the H matrix, which is analogous to the hat matrix in a linear regression model. We develop a method to translate H entries to proportion contributions based on the observation that the rows of H can be interpreted as flow networks, where a stream is defined as the composition of a path and its associated flow. We present an algorithm that identifies the flow of evidence in each path and decomposes it into direct comparisons. To illustrate the methodology, we use two published networks of interventions. The first compares no treatment, quinolone antibiotics, non-quinolone antibiotics and antiseptics for underlying eardrum perforations and the second compares 14 antimanic drugs. We believe that this approach is a useful and novel addition to network meta-analysis methodology, which allows the consistent derivation of the proportion contributions of direct evidence from individual studies to network treatment effects.
Keywords: flow networks; indirect evidence; projection matrix; proportion contributions.
Conflict of interest statement
No competing interests were disclosed.
Figures
References
-
- Jansen JP, Trikalinos T, Cappelleri JC, et al. : Indirect treatment comparison/network meta-analysis study questionnaire to assess relevance and credibility to inform health care decision making: an ISPOR-AMCP-NPC Good Practice Task Force report. Value Health. 2014;17(2):157–73. 10.1016/j.jval.2014.01.004 - DOI - PubMed
Publication types
MeSH terms
LinkOut - more resources
Full Text Sources
Other Literature Sources