Protein responses in kenaf plants exposed to drought conditions determined using iTRAQ technology
- PMID: 30338209
- PMCID: PMC6168693
- DOI: 10.1002/2211-5463.12507
Protein responses in kenaf plants exposed to drought conditions determined using iTRAQ technology
Abstract
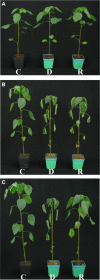
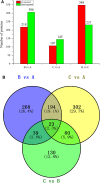
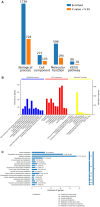
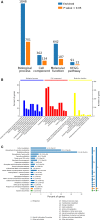
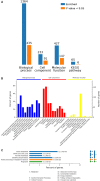
The molecular mechanisms that underlie drought stress responses in kenaf, an important crop for the production of natural fibers, are poorly understood. To address this issue, we describe here the first iTRAQ-based comparative proteomic analysis of kenaf seedlings. Plants were divided into the following three treatment groups: Group A, watered normally (control); Group B, not watered for 6 days (drought treatment); and Group C, not watered for 5 days and then rewatered for 1 day (recovery treatment). A total of 5014 proteins were detected, including 4932 (i.e., 98.36%) that were matched to known proteins in a BLAST search. We detected 218, 107, and 348 proteins that were upregulated in Group B compared with Group A, Group C compared with Group A, and Group B compared with Group C, respectively. Additionally, 306, 145, and 231 downregulated proteins were detected during the same comparisons. Seventy differentially expressed proteins were analyzed and classified into 10 categories: photosynthesis, sulfur metabolism, amino sugar and nucleotide sugar metabolism, oxidative phosphorylation, ribosome, fatty acid elongation, thiamine metabolism, tryptophan metabolism, plant-pathogen interaction, and propanoate. Kenaf adapted to stress mainly by improving the metabolism of ATP, regulating photosynthesis according to light intensity, promoting the synthesis of osmoregulators, strengthening ion transport signal transmission, and promoting metabolism and cell stability. This is the first study to examine changes in protein expression in kenaf plants exposed to drought stress. Our results identified key drought-responsive genes and proteins and may provide useful genetic information for improving kenaf stress resistance.
Keywords: comparative proteomic analysis; drought stress; iTRAQ; kenaf; stress resistance.
Figures



Similar articles
-
Transcriptome analysis and transcription factors responsive to drought stress in Hibiscus cannabinus.PeerJ. 2020 Feb 25;8:e8470. doi: 10.7717/peerj.8470. eCollection 2020. PeerJ. 2020. PMID: 32140299 Free PMC article.
-
Physiological and Transcriptome Analysis Reveal the Underlying Mechanism of Salicylic Acid-Alleviated Drought Stress in Kenaf (Hibiscus cannabinus L.).Life (Basel). 2025 Feb 12;15(2):281. doi: 10.3390/life15020281. Life (Basel). 2025. PMID: 40003690 Free PMC article.
-
Physiological and proteomic analyses of the drought stress response in Amygdalus Mira (Koehne) Yü et Lu roots.BMC Plant Biol. 2017 Feb 27;17(1):53. doi: 10.1186/s12870-017-1000-z. BMC Plant Biol. 2017. PMID: 28241796 Free PMC article.
-
The inhibition of polyamine biosynthesis weakens the drought tolerance in white clover (Trifolium repens) associated with the alteration of extensive proteins.Protoplasma. 2018 May;255(3):803-817. doi: 10.1007/s00709-017-1186-9. Epub 2017 Nov 28. Protoplasma. 2018. PMID: 29181726
-
Genetic engineering to improve plant performance under drought: physiological evaluation of achievements, limitations, and possibilities.J Exp Bot. 2013 Jan;64(1):83-108. doi: 10.1093/jxb/ers326. Epub 2012 Nov 16. J Exp Bot. 2013. PMID: 23162116 Review.
Cited by
-
Transcriptome profiling of kenaf (Hibiscus cannabinus L.) under plumbic stress conditions implies the involvement of NAC transcription factors regulating reactive oxygen species-dependent programmed cell death.PeerJ. 2020 Mar 10;8:e8733. doi: 10.7717/peerj.8733. eCollection 2020. PeerJ. 2020. PMID: 32195056 Free PMC article.
-
Comparative Transcriptome and Proteome Analysis Provides New Insights Into the Mechanism of Protein Synthesis in Kenaf (Hibiscus cannabinus L.) Leaves.Front Plant Sci. 2022 Jun 21;13:879874. doi: 10.3389/fpls.2022.879874. eCollection 2022. Front Plant Sci. 2022. PMID: 35800609 Free PMC article.
References
-
- Harrison MT, Tardieu F, Dong Z, Messina CD and Hammer GL (2014) Characterizing drought stress and trait influence on maize yield under current and future conditions. Glob Chang Biol 20, 867–878. - PubMed
LinkOut - more resources
Full Text Sources
Research Materials

