. 2018 Oct 19:24:7459-7468.
doi: 10.12659/MSM.908142.

Mangiferin Potentiates Neuroprotection by Isoflurane in Neonatal Hypoxic Brain Injury by Reducing Oxidative Stress and Activation of Phosphatidylinositol-3-Kinase/Akt/Mammalian Target of Rapamycin (PI3K/Akt/mTOR) Signaling

Affiliations

Mangiferin Potentiates Neuroprotection by Isoflurane in Neonatal Hypoxic Brain Injury by Reducing Oxidative Stress and Activation of Phosphatidylinositol-3-Kinase/Akt/Mammalian Target of Rapamycin (PI3K/Akt/mTOR) Signaling

Jia-Shui Xi et al. Med Sci Monit. .

Abstract

BACKGROUND Hypoxic-ischemic brain injury in the perinatal period is a main cause of perinatal mortality and neurologic complications in neonates and children. Recent studies have focused on the neuroprotective effect of anesthetic drugs. The volatile anesthetic isoflurane has been shown to exert neuroprotective effects in cerebral ischemia. Mangiferin is a natural polyphenol with various pharmacological properties, including antioxidant and ant-tumor effects. This study aimed to determine whether mangiferin potentiates the neuroprotective effects of isoflurane and also if mangiferin when administered alone exerts neuroprotective effects following hypoxic-ischemic brain injury. MATERIAL AND METHODS Sprague-Dawley rats were subjected to cerebral hypoxic ischemia on postnatal day 10 (P10). Mangiferin (50, 100, or 200 mg/kg b.w.) was intragastrically administered from P3 to P12 and 1 h prior to insult on the day of ischemic induction. At 3 h after hypoxia-ischemia (HI) insult, separate groups of rat pups were exposed to isoflurane (1.5%) for 6 h. Following 48 h of HI, the rats were sacrificed and brain tissues were used for analysis. RESULTS Mangiferin treatment attenuated neuronal apoptosis and reduced cerebral infarct volume. The expression of cleaved caspase-3 and apoptotic cascade proteins were regulated. The levels of reactive oxygen species (ROS) and malondialdehyde were reduced by mangiferin and/or isoflurane exposure. The levels of antioxidant glutathione were considerably raised under HI injury, which was modulated by mangiferin and isoflurane exposure. The PI3K/Akt signaling pathway, which was downregulated following HI insult, was activated by mangiferin and/or isoflurane. CONCLUSIONS This study reveals the potent neuroprotective efficacy of mangiferin against HI-induced brain injury via effectively modulating apoptotic pathways, ROS levels, and PI3K/Akt cascades while potentiating protective effects of isoflurane.


Conflict of interest statement

Conflicts of interest

None.

Figures

Figure 1
Figure 1
Effect of mangiferin and isoflurane on histological changes in the brain tissue following HI using hematoxylin and eosin (H&E) staining. (A – Control; B – HI control; C – Mangiferin (200 mg/kg) + HI; D – HI + Isoflurane (1.5%); E – Mangiferin (100 mg/kg) + HI + Isoflurane; F – Mangiferin (200 mg/kg) + HI + Isoflurane). Representative plates were obtained at 400× magnification.
Figure 2
Figure 2
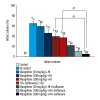
Mangiferin and isoflurane reduced cerebral infarct area. Values are mean ±SD, n=6. p<0.05 as determined by one-way ANOVA followed by DMRT analysis. * Represents p<0.05 vs. control; # represents p<0.05 vs. HI control; @ represents HI + Mangiferin (200 mg) + Isoflurane vs. HI + Isoflurane and Mangiferin (200 mg) + HI at p<0.05 vs. isoflurane. Different letters in different experimental groups indicate significant differences at p<0.05.
Figure 3
Figure 3
(A) Mangiferin and isoflurane decreased neuronal apoptosis as determined by TUNEL assay. Values are mean ±SD, n=6. p<0.05 as determined by one-way ANOVA followed by DMRT analysis. * Represents p<0.05 vs. control; # represents p<0.05 vs. HI control; @ represents HI + Mangiferin (200 mg) + Isoflurane vs. HI + Isoflurane and Mangiferin (200 mg) + HI at p<0.05 vs. isoflurane. Different letters in different experimental groups indicate significant differences at p<0.05. (B) Mangiferin and isoflurane decreased neuronal apoptosis expressions of cleaved caspase-3. Values are mean ±SD, n=6. p<0.05 as determined by one-way ANOVA followed by DMRT analysis. * Represents p<0.05 vs. control; # represents p<0.05 v HI control; @ represents HI + Mangiferin (200 mg) + Isoflurane vs. HI + Isoflurane and Mangiferin (200 mg) + HI at p<0.05 vs. isoflurane. Different letters in different experimental groups indicate significant differences at p<0.05.
Figure 4
Figure 4
Mangiferin and isoflurane regulated apoptotic pathway proteins. Representative Western blot images. L1 – HI control; L2 – Mangiferin (100 mg/kg) + HI; L3 – Mangiferin (200 mg/kg) + HI; L4 – HI + Isoflurane (1.5%); L5 – Mangiferin (100 mg/kg) + HI + Isoflurane; L6 – Mangiferin (200 mg/kg) + HI + Isoflurane.
Figure 5
Figure 5
Mangiferin and isoflurane reduced HI-induced ROS. (A) Values are mean ±SD, n=6. p<0.05 as determined by one-way ANOVA followed by DMRT analysis. * Represents p<0.05 vs. control; # represents p<0.05 vs. HI control; @ represents HI + Mangiferin (200 mg) + Isoflurane vs. HI + Isoflurane and Mangiferin (200 mg) + HI at p<0.05 vs. isoflurane. Different letters in different experimental groups indicate significant differences at p<0.05. (B) Mangiferin and isoflurane reduced HI-induced MDA levels. Values are mean ±SD, n=6. p<0.05 as determined by one-way ANOVA followed by DMRT analysis. * Represents p<0.05 vs. control; # represents p<0.05 vs. HI control; @ represents HI + Mangiferin (200 mg) + Isoflurane vs. HI + Isoflurane and Mangiferin (200 mg) + HI at p<0.05 vs. isoflurane. Different letters in different experimental groups indicate significant differences at p<0.05. (C) Mangiferin and isoflurane reduced HI-induced ROS, MDA levels and enhances GSH levels. Values are mean ±SD, n=6. p<0.05 as determined by one-way ANOVA followed by DMRT analysis. * Represents p<0.05 vs. control; # represents p<0.05 vs. HI control; @ represents HI + Mangiferin (200 mg) + Isoflurane vs. HI + Isoflurane and Mangiferin (200 mg) + HI at p<0.05 vs. isoflurane. Different letters in different experimental groups indicate significant differences at p<0.05.
Figure 6
Figure 6
Effect of mangiferin and propofol on expression of major effector proteins of the PI3K/Akt pathway – representative Western blot images. L1 – HI control; L2 – Mangiferin (100 mg/kg) + HI; L3 – Mangiferin (200 mg/kg) + HI; L4 – HI + Isoflurane (1.5%); L5 – Mangiferin (100 mg/kg) + HI + Isoflurane; L6 – Mangiferin (200 mg/kg) + HI + Isoflurane.

References

    1. Vannucci RC, Connor JR, Mauger DT, et al. Rat model of perinatal hypoxic-ischemic brain damage. J Neurosci Res. 1999;55:158–63. - PubMed
    1. Volpe JJ. Perinatal brain injury: From pathogenesis to neuroprotection. Ment Retard Dev Disabil Res Rev. 2001;7:56–64. - PubMed
    1. Ferrieo DM. Neonatal brain injury. N Engl J Med. 2004;351:1985–95. - PubMed
    1. Sasaoka N, Kawaguchi M, Kawaraguchi Y, et al. Isoflurane exerts a short-term but not a long-term preconditioning effect in neonatal rats exposed to a hypoxic-ischaemic neuronal injury. Acta Anaesthesiol Scand. 2009;53:46–54. - PubMed
    1. Ferriero DM, Bonifacio SL. The search continues for the elusive biomarkers of neonatal brain injury. J Pediatr. 2014;164:438–40. - PubMed

MeSH terms