

Collaborative study of thresholds for mutagens: proposal of a typical protocol for detection of hormetic responses in cytotoxicity tests
- PMID: 30338768
- PMCID: PMC6174566
- DOI: 10.1186/s41021-018-0108-1
Collaborative study of thresholds for mutagens: proposal of a typical protocol for detection of hormetic responses in cytotoxicity tests
Abstract
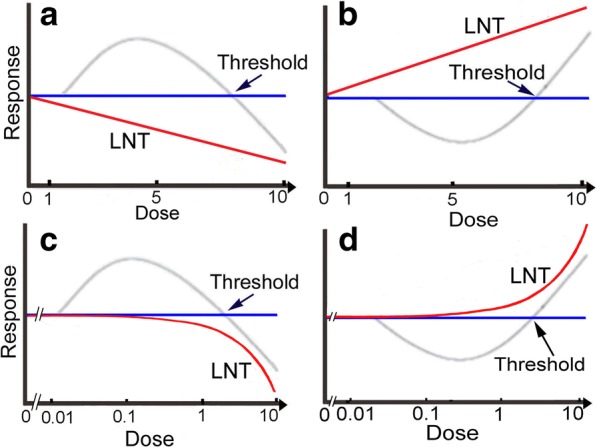
Background: According to the linear no-threshold model (LNT), even the smallest amount of radiation is hazardous. Although the LNT is not based on solid data, this hypothesis has been applied to mutagens and carcinogens. As a result, it has been postulated that there are no thresholds for these chemicals. To demonstrate negativity by experiments is practically impossible, because negative data may leave behind the possibility that additional data might make the resolution power high enough to change negativity to positivity. Furthermore, additional data collection may be endless and we may be trapped in agnosticism. When hormesis is established, in which biological responses are higher at low-doses and lower at high-doses than the control, thresholds could be established between the low- and high-doses. Before examination of thresholds in chemical mutagenesis, hormetic responses in cytotoxicity were tested using cultured mammalian cells.
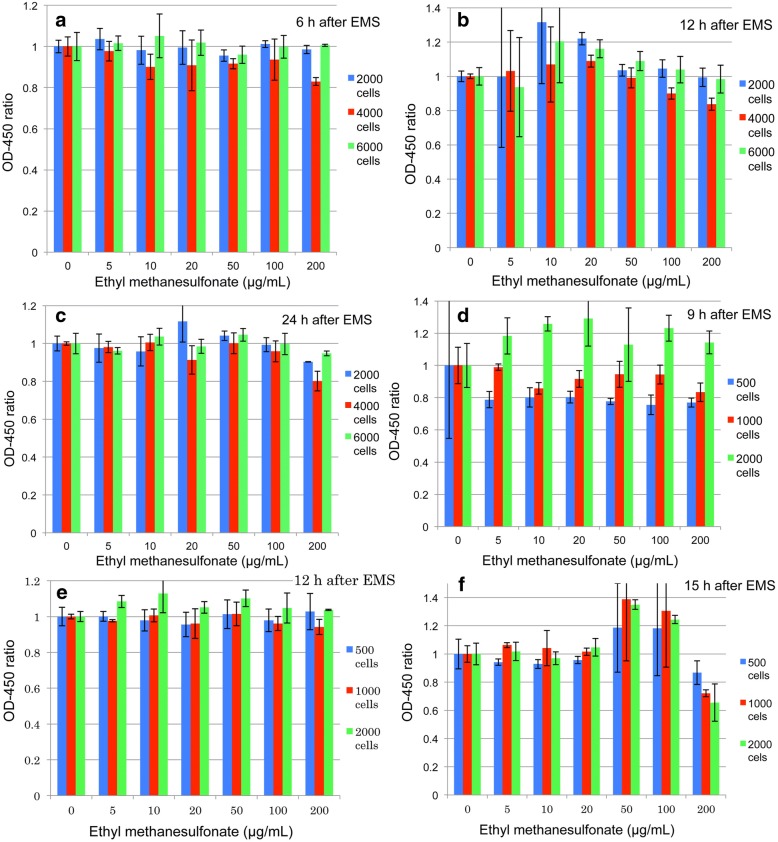
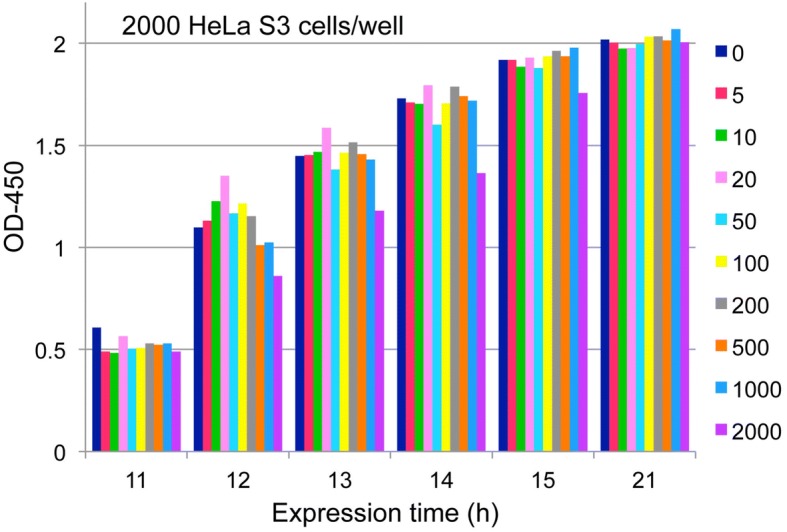
Method: Human cells (HeLa S3 and TK6) or Chinese hamster cells (CHL/IU) were cultured in 96-well plates and treated with mitomycin C (MMC) or ethyl methanesulfonate (EMS) at various dose levels and optical density was measured after addition of a reagent to detect cellular activity. In hormetic responses, data might fluctuate to and fro; therefore, experimental conditions were examined from various aspects to eliminate confounding factors including cell numbers, detection time, the edge effect of 96-well plates, and measurement time after addition of the reagent for detection.
Results: The dose response relationship was never linear. Cellular activities after treatment with MMC or EMS were generally higher at lower doses levels and lower at higher doses than the control, showing hormesis and allowing the establishment of thresholds. Dose response curves sometimes showed two or three peaks, probably reflecting different cellular responses.
Conclusion: Hormetic responses in cytotoxicity tests were observed and thresholds could be established. Based on the results of this investigation, we put forward a tentative protocol to detect chemical hormesis in cytotoxicity tests, i.e., inoculate 2000 cells per well, add various doses of a test chemical 48 h after inoculation, add a detection dye 10 h after treatment, and measure optical density 2 h after addition of the reagent for detection.
Keywords: Adaptive response; CHL/IU; Ethyl methanesulfonate; HeLa S3; Hormesis; Mitomycin C; TK6.
Conflict of interest statement
Not applicable.Not applicable.The authors declare that they have no competing interests.Springer Nature remains neutral with regard to jurisdictional claims in published maps and institutional affiliations.
Figures


Similar articles
-
Collaborative Study of Thresholds for Mutagens: Hormetic Responses in Cell Proliferation Tests Using Human and Murine Lymphoid Cells.Dose Response. 2021 Jun 29;19(2):15593258211028473. doi: 10.1177/15593258211028473. eCollection 2021 Apr-Jun. Dose Response. 2021. PMID: 34262412 Free PMC article.
-
Collaborative Study of Thresholds for Mutagens: Adaptive Responses in the Micronucleus Test and Gene Induction by Mutagenic Treatments.Dose Response. 2024 May 7;22(2):15593258241252040. doi: 10.1177/15593258241252040. eCollection 2024 Apr-Jun. Dose Response. 2024. PMID: 38715588 Free PMC article.
-
The 10th anniversary of the publication of genes and environment: memoir of establishing the Japanese environmental mutagen society and a proposal for a new collaborative study on mutagenic hormesis.Genes Environ. 2017 Mar 1;39:9. doi: 10.1186/s41021-016-0073-5. eCollection 2017. Genes Environ. 2017. PMID: 28265305 Free PMC article.
-
Temporal stability of chemical hormesis (CH): Is CH just a temporary stop on the road to thresholds and toxic responses?Sci Total Environ. 2016 Nov 1;569-570:1446-1456. doi: 10.1016/j.scitotenv.2016.06.233. Epub 2016 Jul 7. Sci Total Environ. 2016. PMID: 27396315 Review.
-
Preconditioning is hormesis part II: How the conditioning dose mediates protection: Dose optimization within temporal and mechanistic frameworks.Pharmacol Res. 2016 Aug;110:265-275. doi: 10.1016/j.phrs.2015.12.020. Epub 2015 Dec 31. Pharmacol Res. 2016. PMID: 26748033 Review.
Cited by
-
Application of image-recognition techniques to automated micronucleus detection in the in vitro micronucleus assay.Genes Environ. 2024 Apr 24;46(1):11. doi: 10.1186/s41021-024-00305-9. Genes Environ. 2024. PMID: 38659010 Free PMC article.
-
The prospective mathematical idea satisfying both radiation hormesis under low radiation doses and linear non-threshold theory under high radiation doses.Genes Environ. 2020 Feb 3;42:4. doi: 10.1186/s41021-020-0145-4. eCollection 2020. Genes Environ. 2020. PMID: 32042364 Free PMC article.
-
Collaborative Study of Thresholds for Mutagens: Hormetic Responses in Cell Proliferation Tests Using Human and Murine Lymphoid Cells.Dose Response. 2021 Jun 29;19(2):15593258211028473. doi: 10.1177/15593258211028473. eCollection 2021 Apr-Jun. Dose Response. 2021. PMID: 34262412 Free PMC article.
-
Sophorolipid Candidates Demonstrate Cytotoxic Efficacy against 2D and 3D Breast Cancer Models.J Nat Prod. 2023 May 26;86(5):1159-1170. doi: 10.1021/acs.jnatprod.2c00804. Epub 2023 Apr 27. J Nat Prod. 2023. PMID: 37104545 Free PMC article.
-
Collaborative Study of Thresholds for Mutagens: Adaptive Responses in the Micronucleus Test and Gene Induction by Mutagenic Treatments.Dose Response. 2024 May 7;22(2):15593258241252040. doi: 10.1177/15593258241252040. eCollection 2024 Apr-Jun. Dose Response. 2024. PMID: 38715588 Free PMC article.
References
-
- Muller HJ. http://www.nobelprize.org/nobel_prizes/medicine/laureates/1946/muller-le.... Accessed 15 Sept 2018
-
- The Rockefeller Foundation. The Rockefeller Foundation Annual Report, 1956. New York: The Rockefeller Foundation Library; 2001.
LinkOut - more resources
Full Text Sources
Research Materials
