Randomized Controlled Trial
. 2018 Oct 19;13(10):e0205639.
doi: 10.1371/journal.pone.0205639. eCollection 2018.

Regression techniques employing feature selection to predict clinical outcomes in stroke

Affiliations
Randomized Controlled Trial

Regression techniques employing feature selection to predict clinical outcomes in stroke

Yazan Abdel Majeed et al. PLoS One. .

Abstract

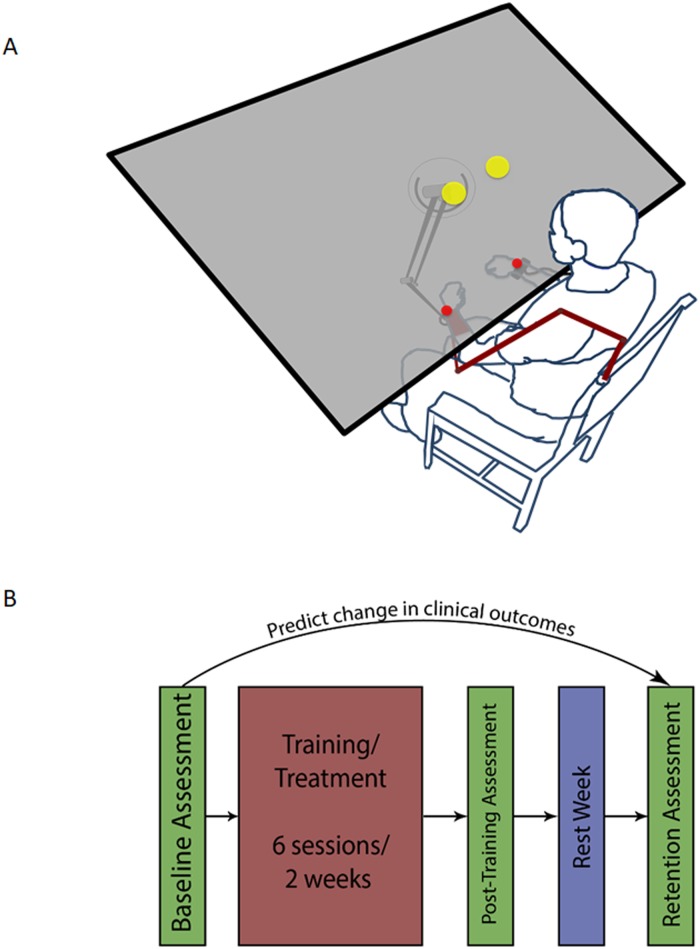
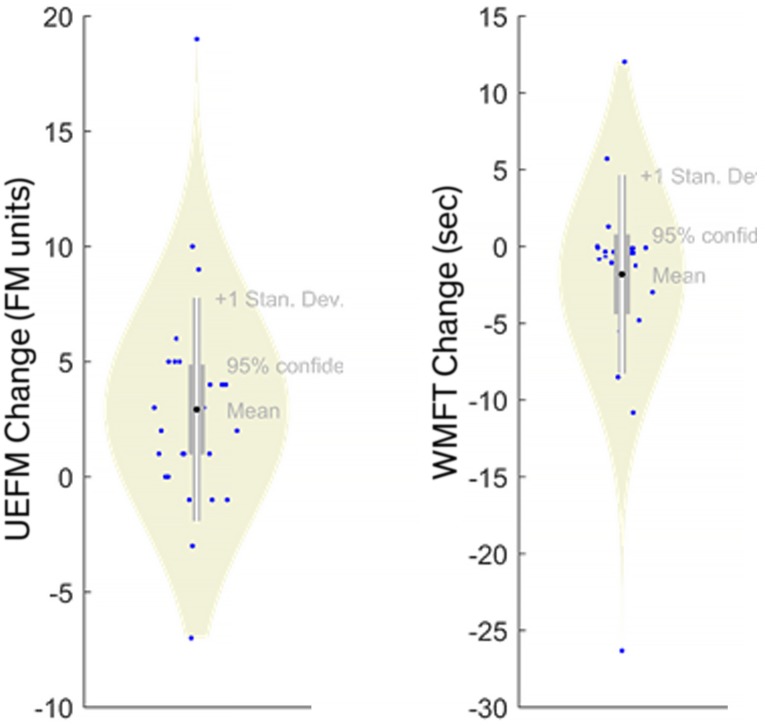
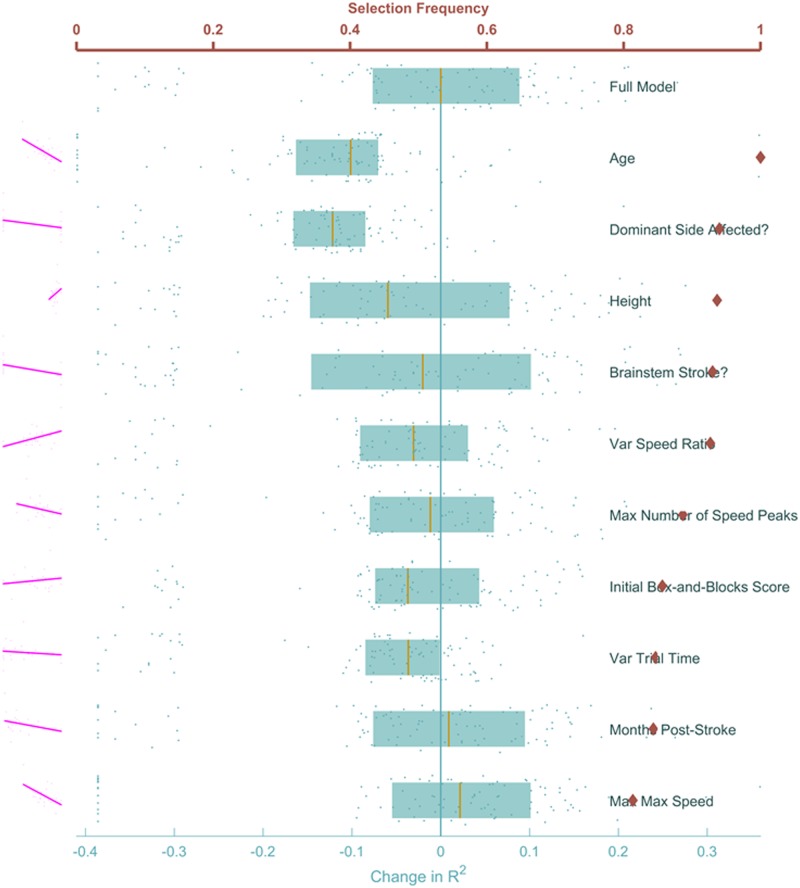
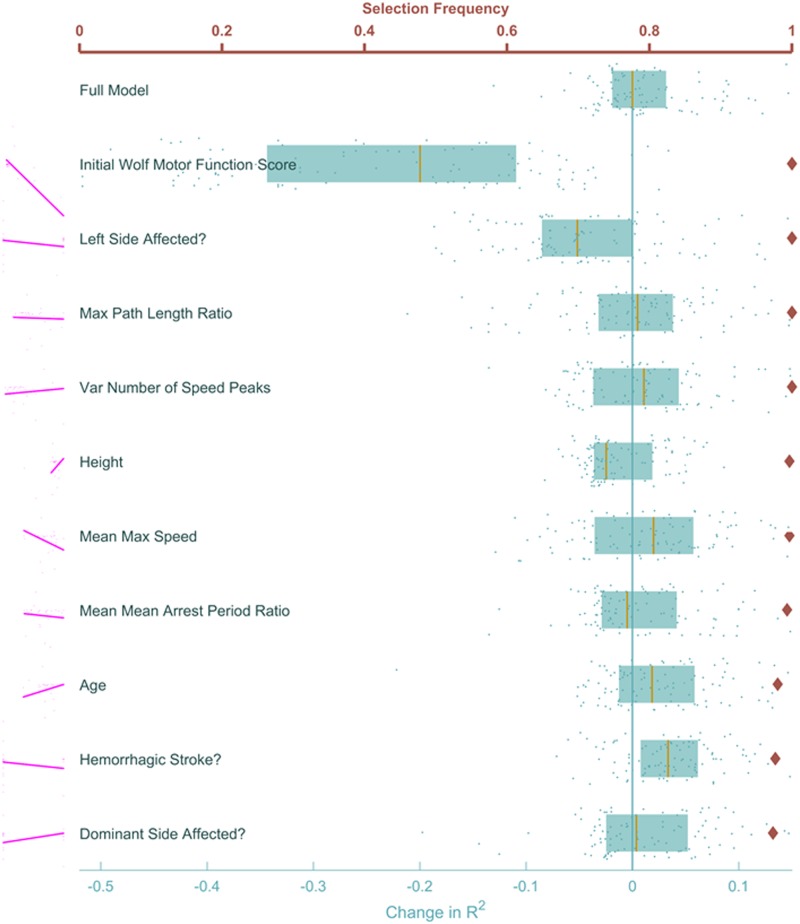
It is not fully clear which measurable factors can reliably predict chronic stroke patients' recovery of motor ability. In this analysis, we investigate the impact of patient demographic characteristics, movement features, and a three-week upper-extremity intervention on the post-treatment change in two widely used clinical outcomes-the Upper Extremity portion of the Fugl-Meyer and the Wolf Motor Function Test. Models based on LASSO, which in validation tests account for 65% and 86% of the variability in Fugl-Meyer and Wolf, respectively, were used to identify the set of salient demographic and movement features. We found that age, affected limb, and several measures describing the patient's ability to efficiently direct motions with a single burst of speed were the most consequential in predicting clinical recovery. On the other hand, the upper-extremity intervention was not a significant predictor of recovery. Beyond a simple prognostic tool, these results suggest that focusing therapy on the more important features is likely to improve recovery. Such validation-intensive methods are a novel approach to determining the relative importance of patient-specific metrics and may help guide the design of customized therapy.


Conflict of interest statement

The authors have declared that no competing interests exist.

Figures

Fig 1
Fig 1. Experiment design.
(A) Patients reach bimanually to two targets, pseudorandomly placed at one of four possible locations in the workspace. Patients return to a central “Home” position after every center-out reach. Patient’s wrists are represented by red spheres. Their task is to get the red spheres inside the yellow targets at the same time. (B) Patients underwent six treatment sessions over two weeks. They were evaluated prior to and immediately after training, as well as one week post-training. Our goal is to use the initial assessment, clinical, and demographic information Table 1 to predict the change in outcome measures between the baseline assessment and the final (retention) assessment.
Fig 2
Fig 2. Model output distributions showing sparsity.
Both UEFM and WMFT include few (sometimes one) subject(s) representing extreme values of clinical change. Clinical changes for these subjects will be difficult to predict under cross validation.
Fig 3
Fig 3. Feature ranking to predict UEFM change.
Red diamonds mark the proportion of times during cross-validation where each feature was selected, with the red horizontal axis on top showing the range. The effect of removing each feature on the adjusted coefficient of determination R2 is shown in blue, each dot represents a single cross-validation run. Blue boxes show the lower quartile, median, and upper quartile of the R2 for each feature. The bottom horizontal axis measures the change in this R2 with respect to the median R2 of the full model, which is represented by the vertical blue line. The full model is shown at the top for comparison. None of the features stood out as clearly redundant or clearly essential for the model. Pairwise correlations of each feature with the outcome are shown in magenta to the left of each row.
Fig 4
Fig 4. Feature ranking to predict WMFT change.
Similar to Fig 3, proportion of cross-validations each feature was selected is shown in red. The blue points and boxplots show the effect of excluding each feature and rerunning the LASSO models with cross-validation. A patient’s initial WMFT score and whether their left side was affected by the stroke are the two features whose removal most negatively impacts the prediction. Conversely, removing information about the patient’s mass, stroke type and location was most helpful to the model, improving the adjusted R2. Notable among the top ten features is mean max speed, which showed a strong correlation with the outcome, indicating patients who were faster on the first day improved more on the WMFT scale.

References

    1. Duncan PW, Lai SM, Keighley J. Defining post-stroke recovery: implications for design and interpretation of drug trials. Neuropharmacology. 2000;39(5):835–841. 10.1016/S0028-3908(00)00003-4 - DOI - PubMed
    1. Platz T, Pinkowski C, van Wijck F, Kim IH, Di Bella P, Johnson G. Reliability and validity of arm function assessment with standardized guidelines for the Fugl-Meyer Test, Action Research Arm Test and Box and Block Test: a multicentre study. Clinical Rehabilitation. 2005;19(4):404–411. 10.1191/0269215505cr832oa - DOI - PubMed
    1. Adams HP, Del Zoppo G, Alberts MJ, Bhatt DL, Brass L, Furlan A, et al. Guidelines for the early management of adults with ischemic stroke. Circulation. 2007;115(20):e478–e534. 10.1161/CIRCULATIONAHA.107.181486 - DOI - PubMed
    1. Duncan PW, Goldstein LB, Matchar D, Divine GW, Feussner J. Measurement of motor recovery after stroke. Outcome assessment and sample size requirements. Stroke. 1992;23(8):1084–1089. 10.1161/01.STR.23.8.1084 - DOI - PubMed
    1. Fugl-Meyer AR, Jääskö L, Leyman I, Olsson S, Steglind S. The post-stroke hemiplegic patient. 1. a method for evaluation of physical performance. Scandinavian journal of rehabilitation medicine. 1974;7(1):13–31. - PubMed

Publication types