

Dendritic spine remodeling accompanies Alzheimer's disease pathology and genetic susceptibility in cognitively normal aging
- PMID: 30339964
- PMCID: PMC6251733
- DOI: 10.1016/j.neurobiolaging.2018.09.003
Dendritic spine remodeling accompanies Alzheimer's disease pathology and genetic susceptibility in cognitively normal aging
Abstract
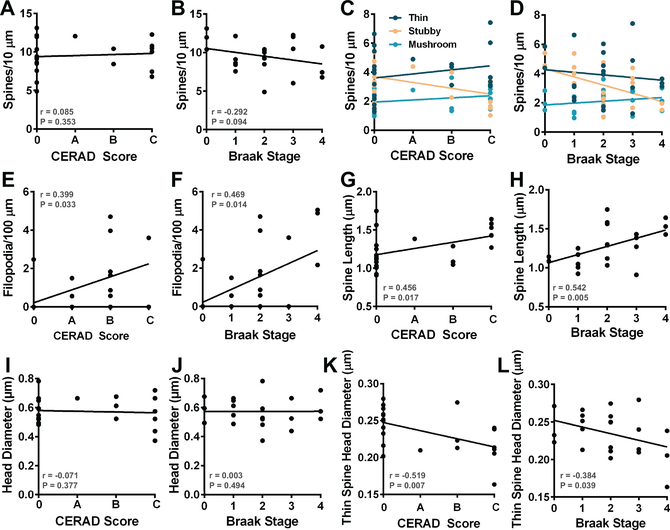
Subtle alterations in dendritic spine morphology can induce marked effects on connectivity patterns of neuronal circuits and subsequent cognitive behavior. Past studies of rodent and nonhuman primate aging revealed reductions in spine density with concomitant alterations in spine morphology among pyramidal neurons in the prefrontal cortex. In this report, we visualized and digitally reconstructed the three-dimensional morphology of dendritic spines from the dorsolateral prefrontal cortex in cognitively normal individuals aged 40-94 years. Linear models defined relationships between spines and age, Mini-Mental State Examination, apolipoprotein E (APOE) ε4 allele status, and Alzheimer's disease (AD) pathology. Similar to findings in other mammals, spine density correlated negatively with human aging. Reduced spine head diameter associated with higher Mini-Mental State Examination scores. Individuals harboring an APOE ε4 allele displayed greater numbers of dendritic filopodia and structural alterations in thin spines. The presence of AD pathology correlated with increased spine length, reduced thin spine head diameter, and increased filopodia density. Our study reveals how spine morphology in the prefrontal cortex changes in human aging and highlights key structural alterations in selective spine populations that may promote cognitively normal function despite harboring the APOE ε4 allele or AD pathology.
Keywords: APOE; Aging; Alzheimer's disease; Dementia; Dendritic spine; Prefrontal cortex; Resiliency.
Copyright © 2018 Elsevier Inc. All rights reserved.
Conflict of interest statement
Disclosure statement
The authors have nothing to disclose and have no conflicts of interest.
Figures


Similar articles
-
Dendritic spines provide cognitive resilience against Alzheimer's disease.Ann Neurol. 2017 Oct;82(4):602-614. doi: 10.1002/ana.25049. Epub 2017 Oct 22. Ann Neurol. 2017. PMID: 28921611 Free PMC article.
-
Evidence for reduced experience-dependent dendritic spine plasticity in the aging prefrontal cortex.J Neurosci. 2011 May 25;31(21):7831-9. doi: 10.1523/JNEUROSCI.0839-11.2011. J Neurosci. 2011. PMID: 21613496 Free PMC article.
-
Cognitive integrity in Non-Demented Individuals with Alzheimer's Neuropathology is associated with preservation and remodeling of dendritic spines.Alzheimers Dement. 2024 Jul;20(7):4677-4691. doi: 10.1002/alz.13900. Epub 2024 Jun 3. Alzheimers Dement. 2024. PMID: 38829680 Free PMC article.
-
Dendritic Spines: Mediators of Cognitive Resilience in Aging and Alzheimer's Disease.Neuroscientist. 2021 Oct;27(5):487-505. doi: 10.1177/1073858420945964. Epub 2020 Aug 19. Neuroscientist. 2021. PMID: 32812494 Free PMC article. Review.
-
Interactive effects of age and estrogen on cortical neurons: implications for cognitive aging.Neuroscience. 2011 Sep 15;191:148-58. doi: 10.1016/j.neuroscience.2011.05.045. Epub 2011 Jun 2. Neuroscience. 2011. PMID: 21664255 Free PMC article. Review.
Cited by
-
Identifying Mechanisms of Normal Cognitive Aging Using a Novel Mouse Genetic Reference Panel.Front Cell Dev Biol. 2020 Sep 11;8:562662. doi: 10.3389/fcell.2020.562662. eCollection 2020. Front Cell Dev Biol. 2020. PMID: 33042997 Free PMC article.
-
Perspectives on ROCK2 as a Therapeutic Target for Alzheimer's Disease.Front Cell Neurosci. 2021 Mar 15;15:636017. doi: 10.3389/fncel.2021.636017. eCollection 2021. Front Cell Neurosci. 2021. PMID: 33790742 Free PMC article.
-
Concerted neuron-astrocyte gene expression declines in aging and schizophrenia.bioRxiv [Preprint]. 2024 Jan 8:2024.01.07.574148. doi: 10.1101/2024.01.07.574148. bioRxiv. 2024. Update in: Nature. 2024 Mar;627(8004):604-611. doi: 10.1038/s41586-024-07109-5. PMID: 38260461 Free PMC article. Updated. Preprint.
-
Comparative neuropathology in aging primates: A perspective.Am J Primatol. 2021 Nov;83(11):e23299. doi: 10.1002/ajp.23299. Epub 2021 Jul 13. Am J Primatol. 2021. PMID: 34255875 Free PMC article. Review.
-
Emerging role of AMPA receptor subunit GluA1 in synaptic plasticity: Implications for Alzheimer's disease.Cell Prolif. 2021 Jan;54(1):e12959. doi: 10.1111/cpr.12959. Epub 2020 Nov 13. Cell Prolif. 2021. PMID: 33188547 Free PMC article. Review.
References
-
- Alvarez VA, Sabatini BL, 2007. Anatomical and physiological plasticity of dendritic spines. Annu Rev Neurosci 30, 79–97. - PubMed
-
- Bai L, Hof PR, Standaert DG, Xing Y, Nelson SE, Young AB, Magnusson KR, 2004. Changes in the expression of the NR2B subunit during aging in macaque monkeys. Neurobiol Aging 25(2), 201–208. - PubMed
-
- Barnes CA, Suster MS, Shen J, McNaughton BL, 1997. Multistability of cognitive maps in the hippocampus of old rats. Nature 388(6639), 272–275. - PubMed
-
- Benavides-Piccione R, Ballesteros-Yanez I, DeFelipe J, Yuste R, 2002. Cortical area and species differences in dendritic spine morphology. J Neurocytol 31(3–5), 337–346. - PubMed
Publication types
MeSH terms
Substances
Grants and funding
LinkOut - more resources
Full Text Sources
Medical
Miscellaneous
