. 2018 Oct 18;72(2):316-327.e5.
doi: 10.1016/j.molcel.2018.08.034.

Cilia-Associated Oxysterols Activate Smoothened

Affiliations

Cilia-Associated Oxysterols Activate Smoothened

David R Raleigh et al. Mol Cell. .

Abstract

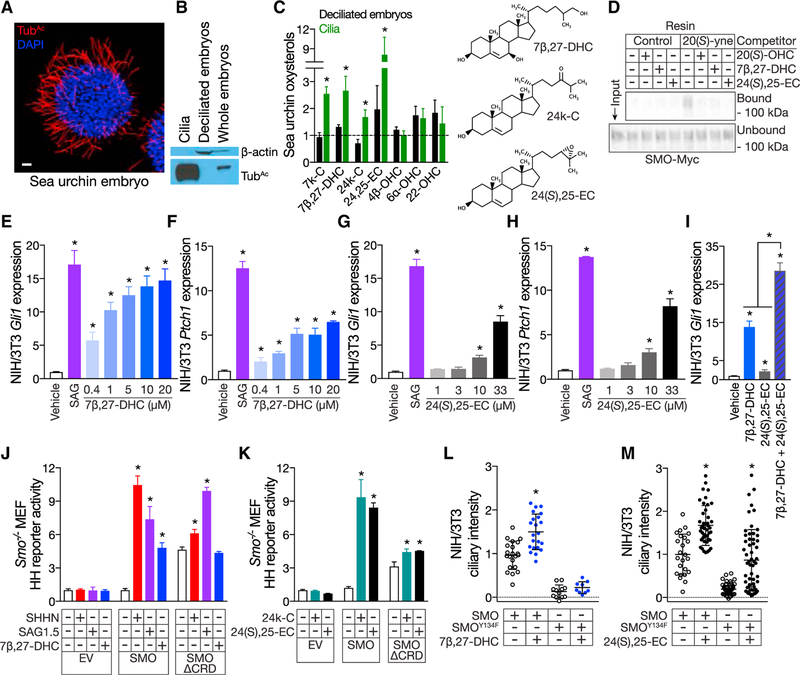
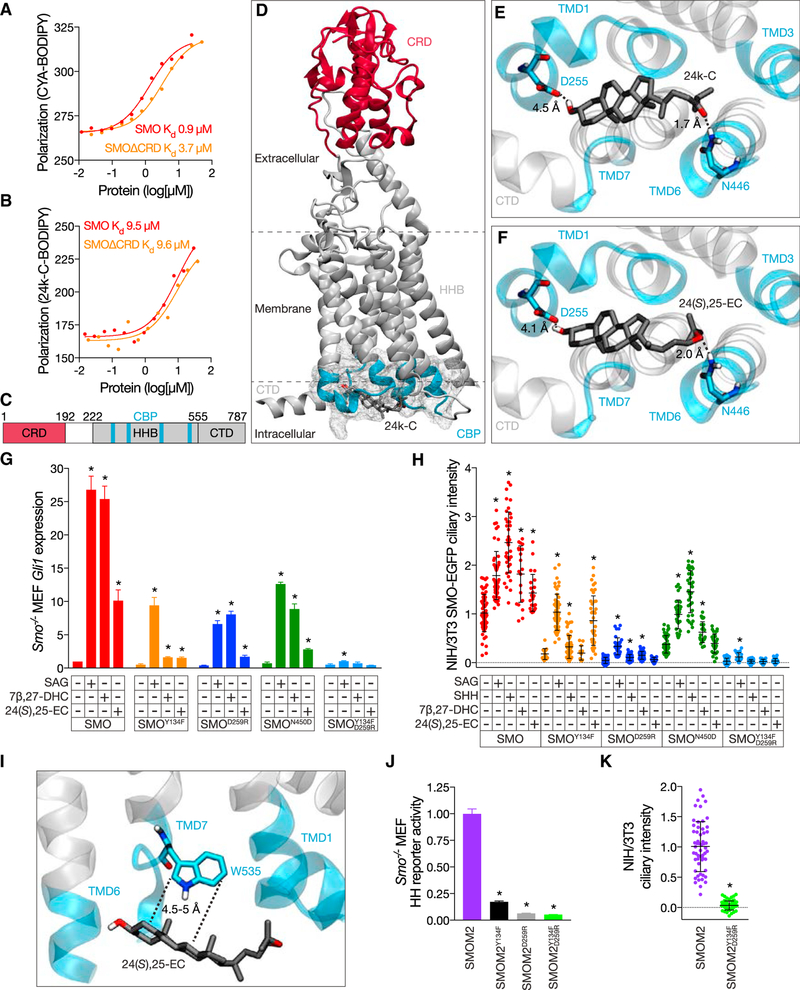
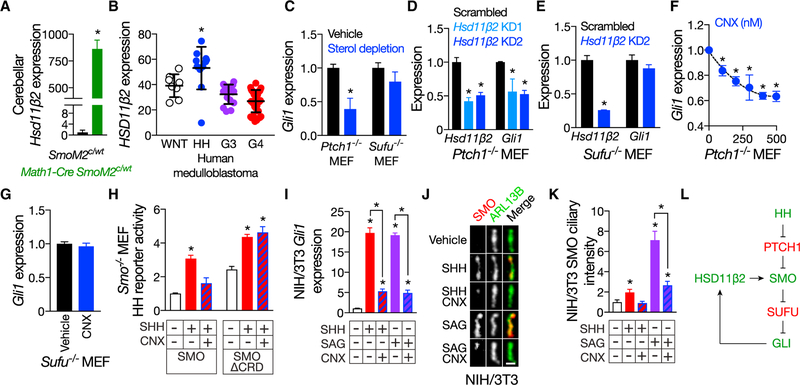
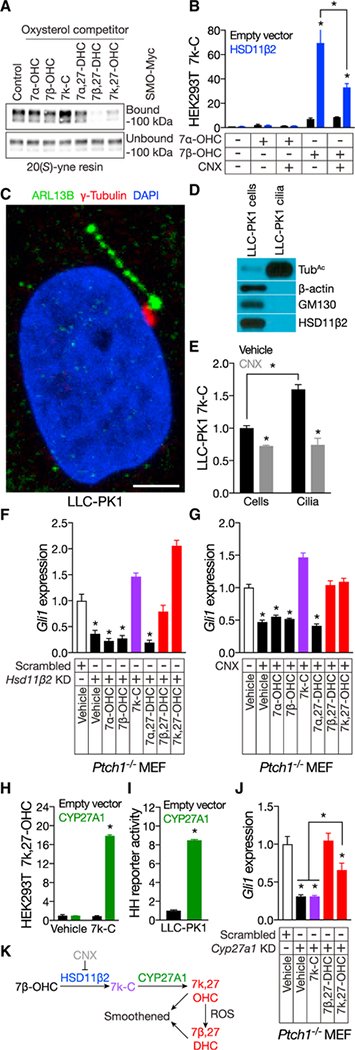
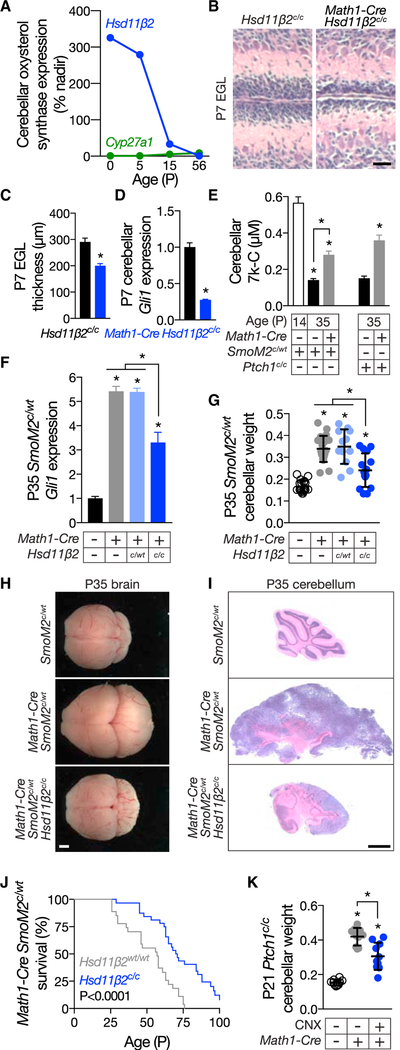
Primary cilia are required for Smoothened to transduce vertebrate Hedgehog signals, but how Smoothened accumulates in cilia and is activated is incompletely understood. Here, we identify cilia-associated oxysterols that promote Smoothened accumulation in cilia and activate the Hedgehog pathway. Our data reveal that cilia-associated oxysterols bind to two distinct Smoothened domains to modulate Smoothened accumulation in cilia and tune the intensity of Hedgehog pathway activation. We find that the oxysterol synthase HSD11β2 participates in the production of Smoothened-activating oxysterols and promotes Hedgehog pathway activity. Inhibiting oxysterol biosynthesis impedes oncogenic Hedgehog pathway activation and attenuates the growth of Hedgehog pathway-associated medulloblastoma, suggesting that targeted inhibition of Smoothened-activating oxysterol production may be therapeutically useful for patients with Hedgehog-associated cancers.

Keywords: CBP; HSD11β2; Hedgehog; Smoothened; cilia; lipid; medulloblastoma; oxysterol; primary cilium; sterol.


Conflict of interest statement

Declaration of Interests

The authors declare no competing interests.

Figures

Figure 1.
Figure 1.. Cilia contain oxysterols that bind the CRD, activate the Hedgehog pathway and cause SMO to accumulate in cilia.
(A) Immunofluorescence of a sea urchin embryo stained for cilia (acetylated tubulin [TubAc], red) and nuclei (DAPI, blue). The scale bar represents 10μm. (B) Immunoblot of lysates from sea urchin cilia, de-ciliated embryos, and whole sea urchin embryos. The ciliary fraction is enriched for TubAc and does not contain detectable components of the cytoplasm (β -actin). (C) HPLC-MS/MS quantitation of oxysterols extracted from de-ciliated sea urchin embryos (black) and isolated cilia (green). Data are normalized to protein concentration and plotted relative to oxysterol levels in whole embryos (dashed line). 7k-C, 7β-DHC, 24k-C, and 24(S),25-EC are enriched in sea urchin embryo cilia. (D) Anti-Myc immunoblot of detergent-solubilized membranes from HEK293S cells expressing SMO-Myc and incubated with 20(S)-yne affinity resin in the presence of 50 mM 20(S)-OHC, 7β-DHC, or 24(S),25-EC in ethanol. 20(S)-OHC, 7β-DHC, and 24(S),25-EC all interfere with the binding of SMO-Myc to 20(S)-yne affinity resin, indicating that they bind the CRD. (E–H) qRT-PCR assessment of Gli1 (E and G) and Ptch1 (F and H) expression by ciliated NIH/3T3 cells treated with vehicle (ethanol), 100 nM SAG, 7β-DHC (E and F), or 24(S),25-EC (G and H). Data are normalized to vehicle control. 7β-DHC and 24(S),25-EC activate the HH pathway in a dose-dependent manner. (I) qRT-PCR assessment of Gli1 expression by ciliated NIH/3T3 cells treated with vehicle (ethanol), 10 mM 7β-DHC, 10 mM 24(S),25-EC, or both. Data are normalized to vehicle control. 7β-DHC and 24(S),25-EC synergistically activate the HH pathway. (J) Luciferase activity in ciliated Smo/ MEFs co-transfected with Gli-luciferase reporter and empty vector (EV), SMO, or SMOΔCRD and treated with vehicle (ethanol), SHHN conditioned media, 10 nm SAG1.5, or ethanol complexed with 30 mM 7β-DHC. Data are normalized to activity in cells expressing SMO and treated with vehicle control. 7β-DHC requires the CRD to activate the HH pathway.. (K) Luciferase activity in ciliated Smo/ MEFs co-transfected with Gli-luciferase reporter and EV, SMO, or SMOΔCRD and treated with vehicle (1 mM MβCD) or MβCD complexed with 30 μM cilia-associated oxysterols. Data are normalized to activity in cells expressing SMO and treated with vehicle control. 24k-C and 24(S),25-EC do not require the CRD to activate the HH pathway. (L and M) Ciliary fluorescence intensity from NIH/3T3 cells stably expressing SMO-EGFP or SMOY134F-EGFP and treated with vehicle (ethanol) or 30 mM 7β,27-DHC (L) or 24(S),25-EC (M). Data are from 2 separate stable cell lines normalized to the average ciliary intensity of SMO-EGFP of cells treated with vehicle. Cilia-associated oxysterols induce SMO accumulation in cilia. Y134F substitution in the CRD blocks the effect of 7β,27-OHC, but not 24(S),25-EC, on ciliary accumulation, further suggesting that 24(S),25-EC can activate SMO independently of the CRD. Histogram error bars show SEM. *p % 0.05; Student’s t test. See also Figures S1 and S2A.
Figure 2.
Figure 2.. Cilia-associated oxysterols and the SMOM2 substitution function through the CBP.
(A and B) Florescence polarization anisotropy of human SMO and SMOΔCRD in response to 20 nM CYA-BODIPY (A) or 50 nM 24k-C-BODIPY (B). Data are shown in a.u. CYA-BODIPY binding to SMO is positively cooperative (Hill coefficient 1.6) with higher affinity than to SMOΔCRD (Hill coefficient 0.8). 24k-C-BODIPY binds to SMO and SMOΔCRD (Hill coefficients 1) with equivalent affinities. (C) Schematic of SMO with relative positions of CRD (red) and a predicted oxysterol binding pocket at the membrane-proximal cytoplasmic surface (CBP, aqua) within the HHB (gray). The C-terminal domain (CTD) is also depicted in gray. Residue numbers demarcating domains are indicated. (D–F) Docking of 24k-C and 24(S),25-EC against human SMO (PDB: 5L7D) predicts oxysterol binding to the CBP (gray mesh encompasses residues in aqua). The CBP is composed of intracellular loops and portions of transmembrane domains (TMDs) 1 (T251-I266), 3 (W339-L346), 6 (N446-I454), and 7 (W535-T553) and is distant from the CRD (red). Residues D255 and N446 (corresponding to D259 and N450 in mouse SMO) are predicted to form hydrogen bonds (dashed lines) with the carbon 3 hydroxyl and iso-octyl tail oxygens, respectively, of 24k-C (E) and 24(S),25-EC (F). Hydrogen bond lengths are shown in angstroms (Å). (G) qRT-PCR assessment of Gli1 expression in ciliated Smo/ MEFs expressing wild-type mouse SMO, SMOY134F, SMOD259R, SMON450D, or SMOY134F, D259R and treated with vehicle (ethanol), 100 nM SAG, or 30 μM 7β-DHC or 24(S),25-EC. Data are normalized to Gli1 expression in wild-type SMO-expressing cells treated with vehicle. Y134F substitution in the CRD attenuates the ability of 7β-DHC and 24(S),25-EC to induce Gli1, whereas D259R and N450D substitutions in the CBP attenuate the effect of 24(S),25-EC. Combined substitutions in the CRD and CBP block the effects of cilia-associated oxysterols and attenuate the effect of SAG. (H) Ciliary fluorescence intensity of NIH/3T3 cells stably expressing mouse SMO-, SMOY134F-, SMOD259R-, SMON450D -, or SMOY134F, D259R-EGFP treated with vehicle (ethanol), 100 nM SAG, 1 μg/mL SHH, or 30 μM 7β-DHC or 24(S),25-EC. Data are from 2 separate cell lines normalized to the average intensity in cells expressing wild-type SMO-EGFP and treated with vehicle. Y134F substitution in the CRD specifically blocks the ability of 7β-DHC to induce SMO accumulation in cilia, whereas the D259R and N450D substitutions in the CBP block the effect 24(S),25-EC. Combined substitutions in the CRD and CBP block the effect of cilia-associated oxysterols and SHH and substantially attenuate the effect of SAG. (I) Docking of 24(S),25-EC against human SMO predicts van der Waals interactions between cilia-associated oxysterols and W535 of the CBP, the residue mutated in SMOM2. Interaction lengths are shown in Å. (J) Luciferase activity of ciliated Smo/ MEFs co-transfected with Gli-luciferase reporter and oncogenic constitutively active form of SMO, SMOM2 (SMOW535L), SMOM2Y134F, SMOM2D259R, or SMOM2Y134F, D259R. Data are normalized to SMOM2 activity. Y134F substitution in the CRD, D259R substitution in the CBP, and combined substitutions in the CRD and CBP inhibit the activity of SMOM2. (K) Ciliary fluorescence intensity of NIH/3T3 cells stably expressing mouse SMOM2- or SMOM2Y134F, D259R-EGFP. Data are from 2 separate cell lines normalized to the average ciliary intensity of cells expressing SMOM2-EGFP. Combined substitutions in the CRD and CBP block SMOM2 accumulation in cilia. Histogram error bars show SEM. *p % 0.05; Student’s t test. See also Figures S2B–S2E.
Figure 3.
Figure 3.. HSD11β2 promotes Hedgehog pathway activation and cause SMO to accumulate in cilia in a manner that requires the CRD.
(A) RNA sequencing of medulloblastomas from P35 Math1-Cre SmoM2c/WT mice compared to control cerebella of P35 SmoM2c/WT littermates indicates that HSD11β2 expression is 864 ± 82-fold higher in HH pathway-associated medulloblastoma. (B) Re-analysis of human transcriptome data SPR008292 indicates that HSD11β2 expression is highest in HH pathway-associated medulloblastoma. Data are shown in a.u. (C) qRT-PCR assessment of Gli1 expression in ciliated Ptch1/ and Sufu/ MEFs treated with vehicle (water) or 1% MβCD and 20 μM pravastatin to deplete sterols. Data are normalized to vehicle treatment. Sterol depletion inhibits HH pathway activation caused by loss of PTCH1, but not loss of SUFU, consistent with a critical role for sterols in SMO activation. (D) qRT-PCR assessment of HSD11β2 and Gli1 expression in ciliated Ptch1/ MEFs transduced with 1 of 2 different HSD11β2 shRNAs. Data are normalized to expression in scrambled shRNA control-transduced cells. HSD11β2 knockdown (KD) inhibits HH pathway activation downstream of PTCH1. (E) qRT-PCR assessment of HSD11β2 and Gli1 expression in ciliated Sufu/ MEFs transduced with HSD11β2 shRNAs. Data are normalized to expression in scrambled shRNA control-transduced cells. HSD11β2 KD does not inhibit HH pathway activation caused by loss of SUFU, consistent with HSD11β2 acting at the level of SMO. (F) qRT-PCR assessment of Gli1 expression in ciliated Ptch1/ MEFs treated with vehicle (water) or CNX. Data are normalized to expression in vehicle-treated cells. Pharmacologic inhibition of HSD11β2 inhibits HH signaling downstream of PTCH1 in a dose-dependent manner. (G) qRT-PCR assessment of Gli1 expression in ciliated Sufu/ MEFs treated with vehicle (water) or 400 nM CNX. Data are normalized to expression in vehicle- treated cells. Pharmacologic inhibition of HSD11β2 does not inhibit HH pathway activation caused by loss of SUFU. (H) Luciferase activity of ciliated Smo/ MEFs co-transfected with Gli-luciferase reporter and SMO or SMOΔCRD and treated with vehicle (water) or 1 μg/mL SHH, with or without 400 nM CNX. Data are normalized to luciferase activity of SMO-expressing cells treated with vehicle. The CRD is required for CNX to block HH pathway stimulation by SHH. (I) qRT-PCR assessment of Gli1 expression in ciliated NIH/3T3 cells treated with vehicle (water), 1 μg/mL SHH, or 100 nM SAG, with or without 400 nM CNX. Data are normalized to expression in vehicle-treated cells. Pharmacologic inhibition of HSD11β2 blocks HH pathway stimulation by SHH or SAG. (J) Immunofluorescence of endogenous SMO (red) localization to cilia (ARL13B, green) in NIH/3T3 cells treated with vehicle (water), 1 μg/mL SHH, or 100 nM SAG, with or without 400 nM CNX. The scale bar represents 1 μm. (K) Quantitation of SMO ciliary immunofluorescence normalized to intensity in vehicle-treated cells. Pharmacologic inhibition of HSD11β2 blocks SMO accumulation in cilia by SHH or SAG. (L) Model of the HSD11β2-mediated HH pathway activation. Pathway activators are shown in green. Pathway inhibitors are shown in red. Histogram error bars show SEM. *p % 0.05; Student’s t test. See also Figure S3.
Figure 4.
Figure 4.. HSD11β2 and CYP27A1 participate in the biosynthesis of SMO-activating oxysterols.
(A) Anti-Myc immunoblot of detergent-solubilized membranes from HEK293S cells expressing Myc-tagged SMO and incubated with 20(S)-yne affinity resin in the presence of 50 mM of the indicated oxysterols. 7β-DHC and 7k,27-OHC, but not 7k-C, compete for occupancy of 20(S)-yne affinity resin, indicating that 7β-DHC and 7k,27-OHC bind the CRD. (B) HPLC-MS/MS measurement of 7k-C in HEK293T cells transfected with empty vector or expressing HSD11β2 and incubated with vehicle (ethanol) or 10 mM 7a-OHC or 7β-OHC, with or without 400 nM CNX. Data are normalized to deuterated 7k-C internal standards and vehicle-treated cells transfected by CNX. (C) Immunofluorescence of a primary cilium (ARL13B, green), basal body (γ-tubulin, red), and nucleus (DAPI, blue) of a LLC-PK1 cell. The scale bar represents 5 μm. (D) Immunoblot of lysates from LLC-PK1 cells and isolated cilia. The ciliary fraction is enriched for the ciliary component acetylated tubulin (TubAc) and does not contain detectable components of the cytoplasm (β-actin) or Golgi (GM130) or HSD11β2. (E) HPLC-MS/MS measurement of 7k-C in LLC-PK1 cells and isolated cilia treated with vehicle (ethanol) or 400 nM CNX. Data are normalized to protein concentration in each sample relative to 7k-C of cells treated with vehicle. LLC-PK1 cilia are enriched in 7k-C, and pharmacologic inhibition of HSD11β2 reduces cellular and ciliary 7k-C. (F) qRT-PCR assessment of Gli1 expression in ciliated Ptch1/ MEFs transduced with scrambled control or HSD11β2 shRNAs and treated with 1 mM MβCD vehicle or 30 μM of the indicated oxysterols. Data are normalized to expression in cells transduced with scrambled shRNA and treated with vehicle. 7k-C, 7β-DHC, and 7k,27-OHC restore HH signaling to HSD11β2-depleted cells. (G) qRT-PCR assessment of Gli1 expression in ciliated Ptch1−/− MEFs treated with 1 mM MβCD vehicle, 400 nM CNX, and 30 μM of the indicated oxysterols. Data are normalized to Gli1 expression in vehicle-treated cells. 7k-C, 7b,27-DHC, and 7k,27-OHC restore HH signaling after pharmacologic inhibition of HSD11β2. (H) HPLC-MS/MS measurement of 7k,27-OHC in HEK293S cells transfected with empty vector or expressing CYP27A1 and incubated with vehicle (ethanol) or 10 μM 7k-C. Data are normalized to deuterated 7k,27-OHC internal standards and vehicle-treated cells transfected with empty vector. CYP27A1 converts 7k-C to 7k,27-OHC. (I) Luciferase activity of ciliated LLC-PK1 cells co-transfected with Gli-luciferase reporter and empty vector or CYP27A1. Data are normalized to activity in empty vector transfected cells. CYP27A1 expression in LLC-PK1 cells is sufficient to activate HH pathway activity. (J) qRT-PCR assessment of Gli1 expression in ciliated Ptch1/ MEFs transduced with scrambled control or Cyp27a1 shRNAs and treated with 1 mM MβCD vehicle or 30 μM of the indicated oxysterols. Data are normalized to expression in cells transduced with scrambled shRNA and treated with vehicle. 7β-DHC and 7k,27-OHC, but not 7k-C, restore HH pathway activity in Cyp27a1-depleted cells. (K) Model of the biosynthesis of SMO-activating oxysterols. Histogram error bars show SEM. *p % 0.05; Student’s t test. See also Figures S1 and S3.
Figure 5.
Figure 5.. HSD11β2 promotes developmental and oncogenic Hedgehog signaling.
(A) Re-analysis of mouse transcriptome data GSE23525 indicates that cerebellar Hsd11β2 expression decreases from birth to postnatal day 56. In contrast, cerebellar Cyp27a1 expression remains largely stable. Data are shown as percent of nadir. (B) H&E-stained micrographs of P7 control Hsd11β2c/c and Math1-Cre Hsd11β2c/c cerebella. The scale bar represents 30 μm. (C) Quantitation of EGL thickness in Hsd11β2c/c and Math1-Cre Hsd11β2c/c cerebella. Homozygous genetic deletion of Hsd11β2 restricts EGL growth. (D) qRT-PCR assessment of Gli1 expression in P7 control Hsd11β2c/c and Math1-Cre Hsd11β2c/c cerebella. Data are normalized to expression in control cerebella. Homozygous deletion of Hsd11β2 attenuates HH pathway activity during cerebellar development. (E) HPLC-MS/MS measurement of 7k-C in control SmoM2c/WT and Ptch1c/c cerebella during development (P14) and/or adulthood (P35) as compared to Math1-Cre SmoM2c/WT and Math1-Cre Ptch1c/c medulloblastomas. 7k-C levels are normalized to sample weights. 7k-C levels are elevated at P14 cerebella and in HH-pathway-associated medulloblastoma. (F) qRT-PCR assessment of Gli1 expression in P35 control SmoM2c/WT cerebella and Math1-Cre SmoM2c/WT, Math1-Cre SmoM2c/WT Hsd11β2c/WT, and Math1-Cre SmoM2c/WT Hsd11β2c/c medulloblastomas. Data are normalized to expression in control cerebella. Homozygous deletion of Hsd11β2 attenuates HH pathway activity in medulloblastoma. (G) Weight of P35 control SmoM2c/WT cerebella and Math1-Cre SmoM2c/WT, Math1-Cre SmoM2c/WT Hsd11β2c/WT, and Math1-Cre SmoM2c/WT Hsd11β2c/c medulloblastomas normalized to total brain weight. Homozygous deletion of Hsd11β2 blocks the growth of HH-pathway-associated medulloblastoma caused by activation of SMO. (H) Gross images of P35 control SmoM2c/WT, Math1-Cre SmoM2c/WT, and Math1-Cre SmoM2c/WT Hsd11β2c/c brains. Homozygous deletion of Hsd11β2 attenuates the growth of HH-pathway-associated medulloblastoma caused by activation of SMO. The scale bar represents 5 mm. (I) Sagittal H&E-stained sections of P35 control SmoM2c/WT cerebella and Math1-Cre SmoM2c/WT and Math1-Cre SmoM2c/WT HSD11β2c/c medulloblastoma. Homozygous deletion of HSD11β2 reduces the number of small round blue tumor cells and partially restores cerebellar architecture in HH-pathway-associated medulloblastoma. The scale bar represents 2 mm. (J) Kaplan-Meier curves of 27 Math1-Cre SmoM2c/WT and 32 Math1-Cre SmoM2c/WT HSD11β2c/c mice. Homozygous deletion of HSD11β2 prolongs the survival of mice with HH-pathway-associated medulloblastoma by 25% (56 days versus 70 days; p < 0.0001; log rank test). (K) Weight of P21 Ptch1c/c control cerebella and Math1-Cre Ptch1c/c medulloblastomas treated with vehicle (water) or 100 mg/g CNX by intraperitoneal injection for 2 weeks, normalized to total brain weight. Pharmacologic inhibition of HSD11β2 attenuates the growth of HH-pathway-associated medulloblastoma caused by loss of Ptch1. Histogram error bars show SEM. *p % 0.05; Student’s t test. See also Figures S4 and S5.

References

    1. Blassberg R, Macrae JI, Briscoe J, and Jacob J (2016). Reduced cholesterol levels impair Smoothened activation in Smith-Lemli-Opitz syndrome. Hum. Mol. Genet 25, 693–705. - PMC - PubMed
    1. Briscoe J, and Therond PP (2013). The mechanisms of Hedgehog signalling and its roles in development and disease. Nat. Rev. Mol. Cell Biol 14, 416–429. - PubMed
    1. Byrne EFX, Sircar R, Miller PS, Hedger G, Luchetti G, Nachtergaele S, Tully MD, Mydock-McGrane L, Covey DF, Rambo RP, et al. (2016). Structural basis of Smoothened regulation by its extracellular domains. Nature 535, 517–522. - PMC - PubMed
    1. Chavez M, Ena S, Van Sande J, de Kerchove d’Exaerde A, Schurmans, tent regulates trafficking and Sonic Hedgehog signaling output. Dev. Cell 34, 338–350. - PubMed
    1. Chen JK, Taipale J, Cooper MK, and Beachy PA (2002a). Inhibition of Hedgehog signaling by direct binding of cyclopamine to Smoothened. Genes Dev. 16, 2743–2748. - PMC - PubMed

Publication types