. 2018 Oct 18;175(3):643-651.e14.
doi: 10.1016/j.cell.2018.08.045.

Enhanced Dendritic Compartmentalization in Human Cortical Neurons

Affiliations

Enhanced Dendritic Compartmentalization in Human Cortical Neurons

Lou Beaulieu-Laroche et al. Cell. .

Abstract

The biophysical features of neurons shape information processing in the brain. Cortical neurons are larger in humans than in other species, but it is unclear how their size affects synaptic integration. Here, we perform direct electrical recordings from human dendrites and report enhanced electrical compartmentalization in layer 5 pyramidal neurons. Compared to rat dendrites, distal human dendrites provide limited excitation to the soma, even in the presence of dendritic spikes. Human somas also exhibit less bursting due to reduced recruitment of dendritic electrogenesis. Finally, we find that decreased ion channel densities result in higher input resistance and underlie the lower coupling of human dendrites. We conclude that the increased length of human neurons alters their input-output properties, which will impact cortical computation. VIDEO ABSTRACT.

Keywords: biophysics; compartmentalization; computation; cortex; dendrite; human; ion channels; neuron; patch-clamp.


Figures

Figure 1.
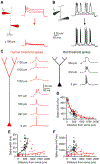
Figure 1.. Human cortical pyramidal L5 neurons exhibit reduced burst firing.
(A) Two-photon Z-stack montage image of human (left) and rat (right) L5 neurons with somatic patch-clamp electrodes. (B) Rat (black) and human (red) somatic voltage in response to step current injections (−300 pA and rheobase). (C-I) Somatic properties of L5 neurons (rat: n=70 recordings from 18 rats; human: n=39 recordings from 6 patients). (C) Left, APs from B expanded to illustrate high frequency bursting in the rat neuron but not the human neuron. Right, maximal AP amplitude reduction (***p<10−10, Wilcoxon rank sum test). Pooled data represent median and interquartile range. (D) Left, first derivative (dV/dt) of voltage waveforms in C. Right, maximal dV/dt reduction (***p<10−8, Wilcoxon rank sum test). Pooled data represent median and interquartile range. (E) Firing rates as a function of injected current. Lines represent population medians with 95% confidence intervals. (F) Minimum instantaneous interspike interval (ISI) as a function of injected current above rheobase. Lines represent population medians with 95% confidence intervals. (G) Percentage of neurons exhibiting bursts (>150 Hz) at rheobase and rheobase + 500 pA. (H) Input resistance (***p<10−3, unpaired t-test). Pooled data represent mean ± SEM. (I) Rheobase (***p<10−11, Wilcoxon rank sum test). Pooled data represent median and interquartile range. See also Figures S1 and S2.
Figure 2.
Figure 2.. Increased input resistance in human dendrites.
(A) Two-photon Z-stack montage image of human (left) and rat (right) L5 neurons with distal patch-clamp electrodes (1374 and 531 μm from the soma, respectively). (B) Rat (top) and human (middle) dendritic voltage in response to step current injections (bottom) from the neurons in A. (C) Input resistance (left) and voltage sag (right) as a function of distance from the soma (rat: n=88 recordings from 22 rats; human: n=42 recordings from 7 patients). Triangles are somatic averages and lines are exponential fit to the data. See also Figures S1 and S3.
Figure 3.
Figure 3.. Increased electrical compartmentalization in human neurons.
(A) Two-photon image of a rat L5 neuron patched at the soma (2) and 579 μm away (1). (B) Dendritic (1; black) and somatic (2; gray) voltage in response to dendritic (top) and somatic (bottom) step current injection of −500 pA. (C) Two-photon image of a human L5 neuron patched 511 (2) and 1507 (1) μm from the soma (996 μm separation). (D) Distal (1; red) and proximal (2; light red) dendritic voltage in response to distal (top) and proximal (bottom) step current injection of −500 pA. (E) Distance-dependent steady-state attenuation towards the soma (rat: n=17 recordings from 9 rats; human: n=16 recordings from 4 patients). Lines represent logistic fit to the data. Dashed lines represent 50% attenuation. (F) Distance-dependent steady-state attenuation towards the distal dendrites (rat: n=19 recordings from 10 rats; human: n=15 recordings from 3 patients). (G) Distal and proximal voltage normalized to distal steady-state voltage (yellow line). For a comparable distance, rat (left) and human (middle) dendrites show similar attenuation. Due to their increased length, human dendrites experience more attenuation (right). See also Figure S4.
Figure 4.
Figure 4.. Weak dendritic spikes in human neurons.
(A) Left, two-photon image of a human L5 neuron patched 535 and 1256 μm from the soma. Right, distal (top) and proximal (bottom) dendritic voltage in response to distal current injection at rheobase and rheobase ± 100 pA. (B) Left, two-photon image of a rat L5 neuron patched at the soma and 536 μm away. Right, distal dendritic (top) and somatic (bottom) voltage in response to dendritic current injection at rheobase and rheobase ± 100 pA. (C) Example human (red) and rat (black) threshold spikes recorded in separate experiments. Spikes (backpropagating APs or locally initiated dendritic events) elicited with local rheobase current injections are shown at the indicated distances from the soma. (D-F) Threshold spike properties as a function of distance from the soma (rat: n=57 recordings from 21 rats; human: n=34 recordings from 7 patients). Triangles are somatic medians and lines are exponential fit to the data. (D) Maximum spike dV/dt. (E) Spike width. (F) Spike area.
Figure 5.
Figure 5.. Increased compartmentalization limits human dendritic spikes.
(A) Two-photon image of a human L5 neuron patched at the soma and 982 μm away. (B) Threshold dendritic spike (top) fails to elicit somatic AP (bottom) in the human neuron shown in A. (C) Two-photon image of a rat L5 neuron patched at the soma and 469 μm away. (D) Under control conditions, the threshold dendritic spike (top) is associated with a somatic burst (bottom) in the rat neuron shown in C. (E) Under somatic voltage clamp to prevent APs (bottom), the threshold dendritic spike is weaker (top) in the rat neuron shown in C. (F) Comparison of dendritic and somatic voltage waveforms from B-E. (G-I) Properties of threshold spikes in distal (>400 μm and >900 μm from the soma in rats and humans, respectively) dendrites (rat: n=43 recordings from 17 rats; human: n=19 recordings from 4 patients). Gray lines link paired measurements for rat dendrites under current clamp and voltage clamp (n=6 recordings from 5 rats). Pooled data represent mean ± SEM. One-way ANOVA followed by multiple comparison tests were used for statistical comparison (***p<10−10 ANOVA, ***p<10−5 R-lclamp vs. R-Vclamp, ***p<10−4 R-lclamp vs. H, p>0.5 R-Vclamp vs. H). (G) Spike width. (H) Spike area. (I) Maximum spike dV/dt. See also Figure S5.
Figure 6.
Figure 6.. Increased compartmentalization limits somatic burst firing in human neurons.
(A) Two-photon image of a rat L5 neuron patched at the soma and 312 μm away. (B) Somatic APs (bottom) and dendritic spike (top) in response to somatic current injection in a rat neuron. Under control conditions, somatic current injection elicits high-frequency AP bursts associated with dendritic spikes. (C) Under dendritic voltage clamp (top), somatic current injection elicits low-frequency APs (bottom). (D) Somatic (bottom) and dendritic (top; 510 μm from the soma) voltage in response to somatic current injection in a human neuron. (E) Comparison of dendritic (top) and somatic (bottom) voltage waveforms from B-D. (F) Minimum ISI as a function of injected current above rheobase (n=8 recordings from 5 rats). Population medians with 95% confidence intervals are shown. (G) Percentage of neurons exhibiting bursts (>150 Hz) at rheobase and rheobase + 500 pA. See also Figure S6.
Figure 7.
Figure 7.. Stretched ion channel distributions in human neurons.
(A) Biophysical model. Top, rat model with schematic density of ion channels in a dendritic segment. Bottom, stretched model where the apical dendrites are lengthened without affecting the total number of ion channels. See also Table S2 and Figure S7. (B) Distance-dependent rat (black) and stretched (red) distribution of voltage-gated ion channels. Transient and persistent voltage-gated potassium channel distributions are illustrated below and above the white dashed lines, respectively. (C) Rat model with dendritic voltage in black and somatic voltage in gray. Top, the threshold dendritic spike is associated with a somatic burst. Bottom, high-frequency APs are coupled to a dendritic spike. (D) Stretched model with dendritic voltage in red and somatic voltage in light red. Top, the threshold dendritic spike fails to elicit somatic AP. Bottom, low-frequency somatic APs fail to engage distal dendrites. (E) Two-photon Z-stack montage image of human (left) and rat (right) L5 neurons with distal patch-clamp electrodes (1514 and 514 μm from the soma, respectively). (F) Whole-cell recordings were used to measure subthreshold properties, including input resistance and voltage sag. Outside-out patches were subsequently pulled from the same location to measure the local density of HCN channels. (G) Whole-cell voltage waveforms in the rat (black) and human (red) dendrites illustrated in E in response to a hyperpolarizing current step (bottom). (H) Top, ensemble HCN currents recorded in outside-out patches excised from the rat (black) and human (red) dendrites illustrated in E. Bottom, voltage-clamp protocol. (I-J) Ensemble HCN current properties in distal (>400 μm and >900 μm from the soma in rats and humans, respectively; ranging 55-85% of the distance from the soma to the pia) dendrites (rat: n=56 recordings from 8 rats; human: n=34 recordings from 2 patients). (I) Population average of ensemble HCN currents. (J) HCN steady-state currents (***p<10−9, Wilcoxon rank sum test). Pooled data represent median and interquartile range.

Comment in

Similar articles

Cited by

References

    1. Atkinson SE, and Williams SR (2009). Postnatal Development of Dendritic Synaptic Integration in Rat Neocortical Pyramidal Neurons. Journal of neurophysiology 102, 735–751. - PMC - PubMed
    1. Beaulieu-Laroche L, and Harnett MT (2018). Dendritic Spines Prevent Synaptic Voltage Clamp. Neuron 97, 75–82.e73. - PubMed
    1. Carnevale NT, and Hines ML (2006). The NEURON Book (Cambridge: Cambridge University Press; ).
    1. Cichon J, and Gan WB (2015). Branch-specific dendritic Ca(2+) spikes cause persistent synaptic plasticity. Nature 520, 180–185. - PMC - PubMed
    1. Connors BW, Gutnick MJ, and Prince DA (1982). Electrophysiological properties of neocortical neurons in vitro. Journal of neurophysiology 48, 1302–1320. - PubMed

Publication types