. 2018 Oct 18;175(3):796-808.e14.
doi: 10.1016/j.cell.2018.09.029.

Determinants of Polar versus Nematic Organization in Networks of Dynamic Microtubules and Mitotic Motors

Affiliations

Determinants of Polar versus Nematic Organization in Networks of Dynamic Microtubules and Mitotic Motors

Johanna Roostalu et al. Cell. .

Abstract

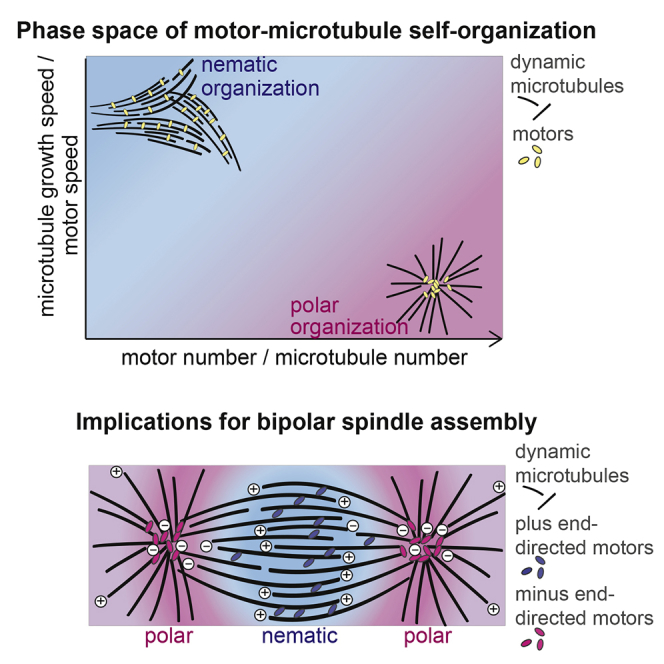
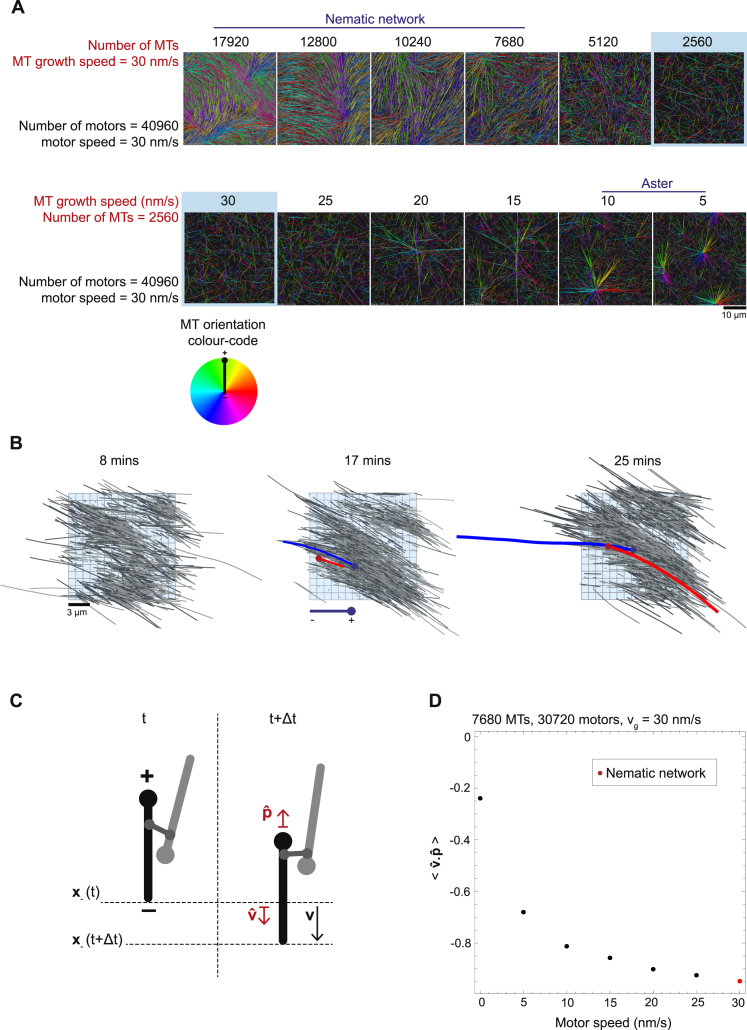
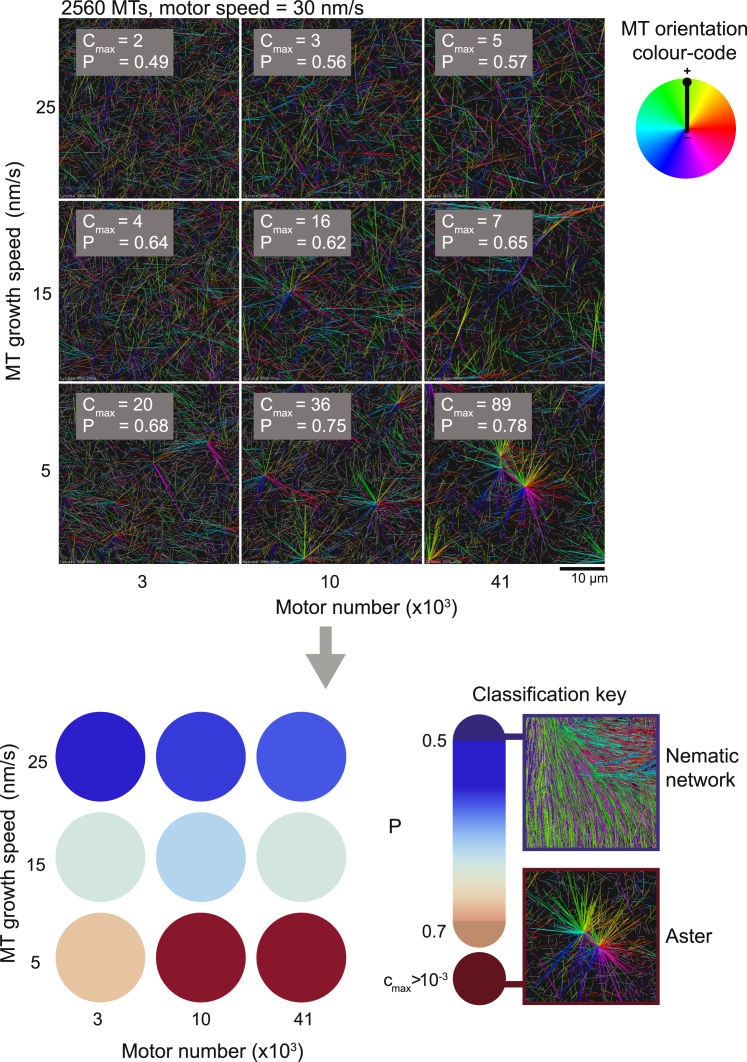
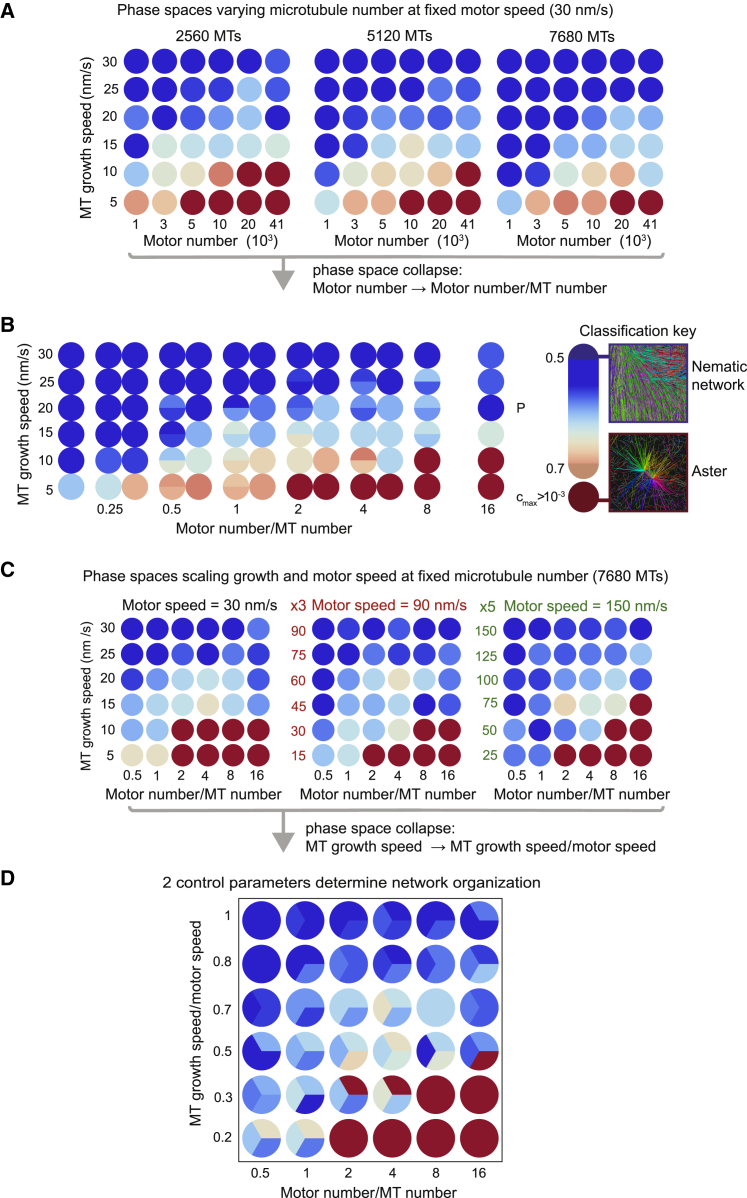
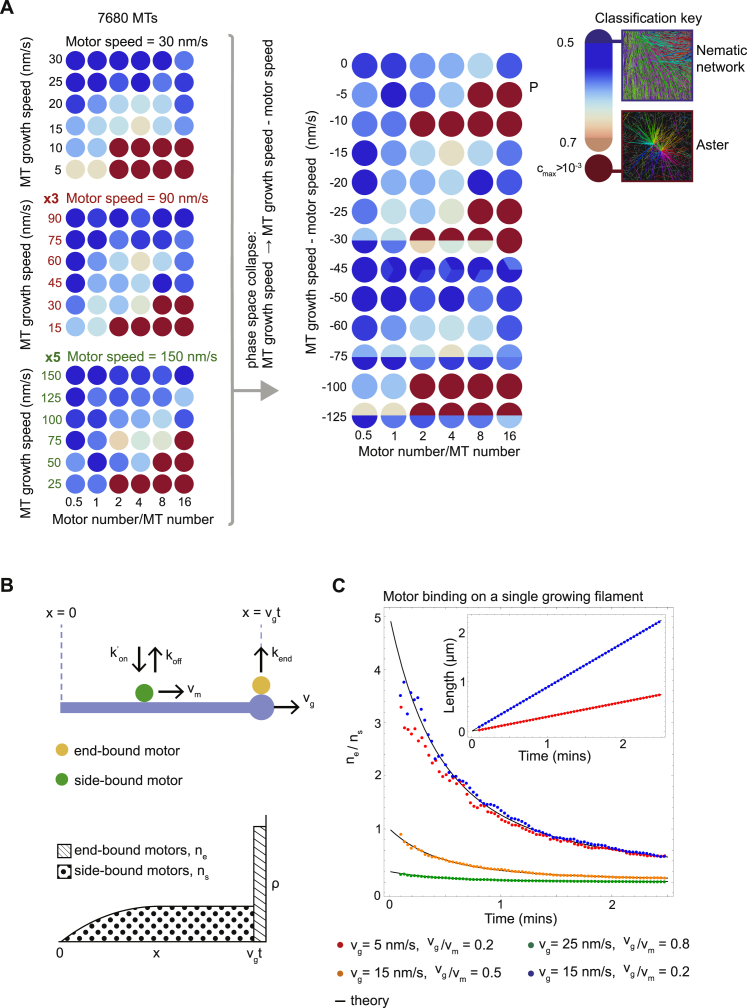
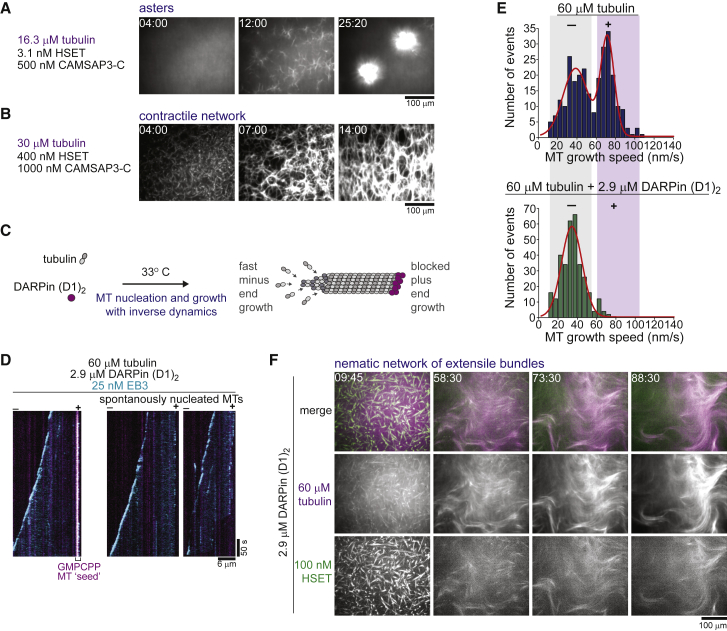
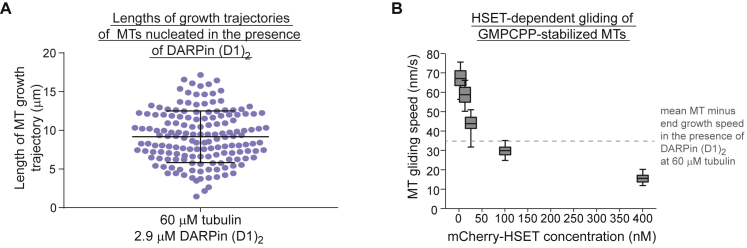
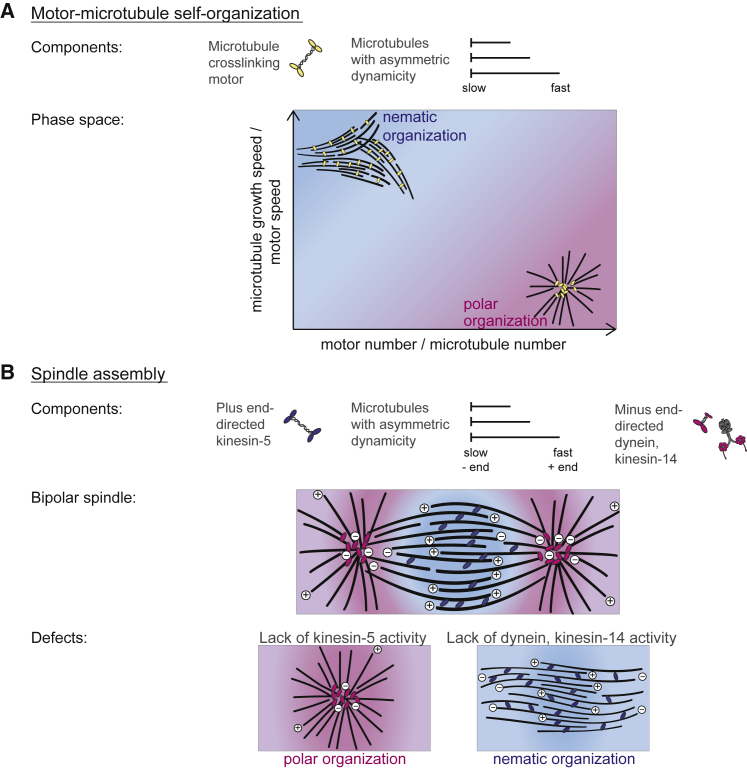
During cell division, mitotic motors organize microtubules in the bipolar spindle into either polar arrays at the spindle poles or a "nematic" network of aligned microtubules at the spindle center. The reasons for the distinct self-organizing capacities of dynamic microtubules and different motors are not understood. Using in vitro reconstitution experiments and computer simulations, we show that the human mitotic motors kinesin-5 KIF11 and kinesin-14 HSET, despite opposite directionalities, can both organize dynamic microtubules into either polar or nematic networks. We show that in addition to the motor properties the natural asymmetry between microtubule plus- and minus-end growth critically contributes to the organizational potential of the motors. We identify two control parameters that capture system composition and kinetic properties and predict the outcome of microtubule network organization. These results elucidate a fundamental design principle of spindle bipolarity and establish general rules for active filament network organization.

Keywords: Cytosim; active network; computer simulation; cytoskeleton; in vitro reconsititution; kinesin; microtubule; molecular motor; self-organization; spindle assembly.


Figures

None
Graphical abstract
Figure 1
Figure 1
Self-Organization of Microtubules and Plus-End-Directed Motor KIF11 into Nematic Networks of Extensile Bundles (A) Scheme of CAMSAP3-C-mediated asymmetric microtubule growth. (B) Total internal reflection fluorescence (TIRF) microscopy images of 25 nM Alexa546-labeled SNAP-EB3 (Alexa546-EB3, cyan) tracking growing microtubule ends in the absence and presence of 250 nM mGFP-CAMSAP3-C at 30 μM tubulin. GMPCPP-stabilized microtubule “seeds” in magenta. Background subtracted maximum intensity projections of 25 frames imaged at 1/s 10 min after the start of microtubule nucleation are shown. (C) Kymographs showing microtubule plus-end growth using 25 nM Alexa546-EB3 in the presence of 250 nM mGFP-CAMSAP3-C starting 2 and 60 min after microtubule nucleation. Yellow arrowheads indicate non-growing minus-ends. (D) Microtubule growth speed distribution in the absence (top) and presence (bottom) of 250 nM mGFP-CAMSAP3-C at 30 μM tubulin. Number of growth episodes measured: without mGFP-CAMSAP3-C, 239; with mGFP-CAMSAP3-C, 148. Despite CAMSAP3-C not being restricted to microtubule minus-ends under these high CAMSAP3-C concentrations (Atherton et al., 2017), nucleated microtubules have asymmetric growth dynamics. (E) Scheme of motor/microtubule self-organization experiment. (F) Confocal fluorescence microscopy images showing time course of KIF11-mGFP-mediated (green) organization of a nematic network of extensile bundles of CF640R-labeled microtubules (magenta). Protein concentrations were: tubulin, 30 μM; mCherry-CAMSAP3-C, 1,000 nM; and KIF11-mGFP, 27 nM. Time in min:s. Temperature was 33°C. See also Figure S2 and Video S1.
Figure S1
Figure S1
Coomassie-Stained SDS Gel with Purified Recombinant Proteins Used in This Study, Related to STAR Methods
Figure S2
Figure S2
KIF11-Dependent Organization of Nematic Networks of Extensile Bundles, Related to Figure 1 (A) Binary confocal fluorescence microscopy images showing at high time-resolution the time course of dynamic fluorescent microtubule bundle extension within a nematic network organized by KIF11. (B) Binary confocal fluorescence microscopy images showing the separation of two photo-bleached marks (yellow asterisks) in an extensile bundle within a nematic network organized by KIF11. Binary images (after background subtraction and thresholding) of the microtubule channel are presented to enhance the visibility of distinct network parts. Time is in min:s. (C) Nematic networks organized by KIF11 are three-dimensional as revealed by confocal imaging of different focal planes in the flow chamber. Experiments presented in A - C were performed in the presence of 27 nM KIF11-mGFP, 30 μM tubulin, and 1000 nM mCherry-CAMSAP3-C. (D) Scatterplot depicting microtubule growth episode lengths at different CAMSAP3-C concentrations. Number of growth episodes measured at different mGFP-CAMSAP3-C concentrations: 250 nM – 80, 500 nM – 54, 1000 nM – 107. Horizontal lines indicate the mean and the standard deviation. (E) Box-and-whiskers plot depicting the dependence of KIF11-driven microtubule gliding speeds on the KIF11-mGFP concentration used to immobilise the motor on the glass surface for gliding assays with GMPCPP-stabilized microtubules. The measured speeds agree with previously reported speeds of metazoan kinesin-5 motors (Cole et al., 1994, Hentrich and Surrey, 2010, Kapitein et al., 2005, Krzysiak et al., 2006, Ma et al., 2011, Sawin et al., 1992, van den Wildenberg et al., 2008). The boxes extend from 25th to 75th percentiles, the whiskers extend from 5th to 95th percentiles, and the mean value is plotted as a line in the middle of the box. Number of gliding episodes measured at different KIF11-mGFP concentrations: 20.5 nM – 77, 41 nM – 87, 82 nM – 150, 164 nM – 128, 328 nM – 105. All experiments were carried out in self-organization buffer at 33°C.
Figure 2
Figure 2
CAMSAP3-C Concentration Influences Microtubule Self-Organization by Affecting Microtubule Growth Speed and Density (A) Confocal fluorescence microscopy images showing a time course of KIF11-mGFP-dependent organization of CF640R-labeled microtubules at different mCherry-CAMSAP3-C concentrations. Tubulin and KIF11 are present at 30 μM and 27 nM, respectively. Time in min:s. (B) Box-and-whiskers plot depicting microtubule plus-end growth speeds at different CAMSAP3-C concentrations. The boxes extend from 25th to 75th percentiles, the whiskers extend from 5th to 95th percentiles, and the mean value is plotted as a line in the middle of the box. Number of plus-end growth episodes measured at different mGFP-CAMSAP3-C concentrations: 0 nM, 61; 250 nM, 148; 500 nM, 72; 1,000 nM, 186. The same source data has been used for the 0 nM and 250 nM condition as for Figure 1D. The shaded area indicates the typical range of KIF11-dependent microtubule transport speeds as estimated from microtubule gliding assays in the same buffer (Figure S2E). (C) TIRF microscopy images of 25 nM Alexa546-EB3 tracking growing microtubule ends showing enhanced microtubule formation at increasing mGFP-CAMSAP3-C concentrations at 30 μM tubulin (imaged at 2 min 20 s after initiating microtubule nucleation). Temperature was 33°C.
Figure 3
Figure 3
Tubulin and KIF11 Concentrations Influence Microtubule Network Organization (A) Box-and-whiskers plot depicting microtubule plus-end growth speeds at different CAMSAP3-C concentrations. Number of plus-end growth episodes measured at different tubulin concentrations: 7.5 μM, 31; 15 μM, 17; 30 μM, 72. The boxes extend from 25th to 75th percentiles, the whiskers extend from 5th to 95th percentiles, and the mean value is plotted as a line in the middle of the box. The same data is plotted for the 30 μM condition at 500 nM mGFP-CAMSAP3-C as for Figure 2A. (B) TIRF microscopy images of CF640R-labeled microtubules showing enhanced microtubule formation at increasing tubulin concentrations in the presence of 500 nM mGFP-CAMSAP3-C (imaged 2 min 20 s after initiating microtubule nucleation). (C–F) Confocal fluorescence microscopy images showing the time course of KIF11-mediated organization of different types of networks at the following respective concentrations for tubulin and KIF11: 20 μM and 27 nM (C), 10 μM and 27 nM (D), 7.5 μM and 82 nM (E), and 15 μM and 164 nM (F). The mCherry-CAMSAP3-C concentration was always 500 nM. Time in min:s. (G) Organizational phase spaces summarizing the different experimental outcomes of KIF11-mediated microtubule network organization as a function of KIF11 and tubulin concentrations (left) and as a function of CAMSAP3-C and tubulin concentrations (right). Both plots pool the outcomes of the same 60 self-organization reactions. Temperature was 33°C. See also Videos S2 and S3.
Figure S3
Figure S3
Schematic Showing the Elements of Cytosim, Related to STAR Methods
Figure 4
Figure 4
Computer Simulations Reveal Two Distinct Microtubule/Motor Organizational States (A) Snapshots showing the evolution of a nematic microtubule network. Simulated time in min:s. All simulation images are 3D projections of a snapshot onto the x-y plane. Colors indicate microtubule orientation (code: right). For visual clarity unconnected microtubules bearing no crosslinking motors are displayed in gray. (B) Snapshots showing the evolution of asters. Simulated time in min:s. (C) Schematic defining 5 different ways in which a motor can crosslink two microtubules (left). Schematic representations of the organization of microtubules and the composition of crosslinks in the nematic network state and the aster state (middle and right). (D) Final snapshot of a nematic network showing only microtubules (left) and only motor crosslinks color-coded according to their type as in (C) (middle). Plot showing the time courses of different populations of motor crosslinks (colored lines, color-coded as in C) and the average microtubule length (black dashed line) for the nematic network (right). (E) Final snapshot of an aster state showing only microtubules (left) and only motor crosslinks color-coded according to their type as in (C) (middle). Plot showing the time courses of different populations of motor crosslinks (colored lines, color-coded as in C) and the average microtubule length (black dashed line) for the aster state (right). Simulation parameters are the same as in (A) and (B) for the nematic network and the asters, respectively. See also Figure S4 and Videos S4 and S5.
Figure S4
Figure S4
The Nematic Network State Exhibits Extensile Behavior, Related to Figure 4 There is a gradual transition between the nematic and aster state upon decreasing microtubule number and microtubule growth speed. (A) Snapshots of final simulation outcomes as parameters are systematically varied. The number of microtubules (top) and the microtubule growth speed (bottom) are varied while holding all other parameters constant. The colored blue border indicates simulations with the same parameter values. The type of organizational state is labeled above the simulation snapshot. All simulation images are three-dimensional projections of a snapshot onto the x-y plane. Colors indicate microtubule orientation. Color code: below, left. For visual clarity unconnected microtubules bearing no crosslinking motors are displayed in gray. See Table S1 for simulation parameters if not shown. (B) Time-course showing simulation snapshots of a nematic network (taken from Video S4). An aligned domain of microtubules is isolated from the network and shown alone so that the extension of the domain can be clearly seen. Microtubules within this domain are selected on the basis that any point along their length falls within the volume described by (−5 < x < 10 μm, −10 < y < 5 μm, −0.2 < z < 0.2 μm) (shown by a colored blue box, the origin is located at the center of the simulation space) and their long axis is oriented at an angle of −93° < θ < −53° with respect to the vertical. Microtubules colored in light and dark gray point in opposite directions. The trajectories of two oppositely oriented microtubules are highlighted (blue and red). The distance between their static minus ends increases due to anti-parallel sliding by motors while their plus-ends grow. Overall anti-parallel sliding results in the narrowing and lengthening of the entire domain along its long axis over time. (C) Schematic illustration of the calculation of the parameter vˆpˆ (STAR Methods) for a single microtubule (black) driven backward via a crosslinking motor connecting it to an anti-parallel microtubule (gray). (D) A plot showing the average value vˆpˆ (STAR Methods) for a range of different motor speeds. Each point represents one simulation and the final point (red) represents the nematic network state. The increasing negative value of vˆpˆ with motor speed demonstrates that microtubules are being continuously transported backward by motors, which drives the extension of the aligned microtubule domains.
Figure S5
Figure S5
Visualization of the Phase Space of Simulated Microtubule-Motor Networks by Classifying and Color-Coding the Network Types, Related to Figure 5 Bespoke order parameters reveal a gradual transition between nematic and polar states. Final snapshots from 9 of the simulations from the phase space in Figure 5A, left, are shown. All simulation images are three-dimensional projections of a snapshot onto the x-y plane. Colors indicate microtubule orientation. Color code: right. For visual clarity unconnected microtubules bearing no crosslinking motors are displayed in gray. Each simulation outcome is classified using two bespoke parameters cmax and P (STAR Methods). The values of Cmax and P are shown overlaid on the snapshots, where Cmax = cmax x microtubule number. The classified state is displayed in the phase space below as a colored circle according to the classification key (left of the phase space). Due to low microtubule numbers in this parameter scan the nematic states (blue circles) show less alignment than the nematic network of aligned microtubule domains described in Figures 4A and 4D. However, the degree of polarity-sorting, captured by P, is similar in both cases.
Figure 5
Figure 5
Computational Exploration of the Multi-Dimensional Parameter Space of Microtubule/Motor Networks Reveals Critical Parameters Driving Active Network Organization (A) Three phase spaces showing the organizational state of the network as a function of microtubule growth speed and motor number at three different numbers of microtubules. Simulation outcomes are classified (Figure S5; STAR Methods) and color-coded (see “Classification key”). Each circle represents one simulation. (B) Phase spaces in (A) can be collapsed onto a single space by plotting the classified states as a function of growth speed and the number of motors per microtubule. Where simulations are coincident in the collapsed phase space the circle is divided between them. (C) Three collapsed phase spaces for three different motor and microtubule speed scalings. Speeds are increased by a factor of 3 (middle) and 5 (right). (D) Phase spaces in (C) can be collapsed onto a single space by plotting the classified states as a function of the ratio of growth speed to motor speed and the number of motors per microtubule. For all simulations see Table S1 for parameter values if not shown. See also Figure S6.
Figure S6
Figure S6
The Ratio of Motor Speed vm to Microtubule Growth Speed vg Determines the Ratio of End-Bound Motors to Side-Bound Motors on a Single Microtubule, Related to Figure 5 (A) Failed attempt to collapse the three phase spaces in Figure 5C plotting here the difference in motor speed and growth speed against motor number per microtubule. Different colors indicate different types of network according to the classification key shown on the right (STAR Methods). Where simulations are coincident in the collapsed phase space the circle is divided between them. y axis is not shown to scale. Compare with the successful phase space collapse using the ratio of motor speed and growth speed in Figure 5D. (B) (Top) Schematic representation of the single filament model showing binding and unbinding kinetics of a motor on a microtubule. Binding and unbinding of motors from the side of the microtubule occurs at rates kon and koff respectively. Motors move deterministically at speed vm to the plus-end that is growing at speed vg. Motors unbind from the plus-end at rate kend. (Bottom) Example motor density profile. Dotted area represents the total number of motors on the side, ns, and lined area represents the total number of motors at the plus-end, ne. (C) Time evolution of the ratio of end-bound motors to side-bound motors on a single growing microtubule for different pairs of parameters vm and vg. Colored points represent average results from 4 simulations (see Table S1 for parameter values) and black lines correspond to theory (Equation S5). Inset shows the average length of the microtubules over the same period for two parameter sets. For the same ratio but different magnitudes of vm and vg (red circles, blue crosses), the ratio of side-bound to end-bound motors will be the same at a given time point in the microtubule’s lifetime, although the lengths of the microtubules will differ at this time. This provides a mechanistic explanation as to why the ratio of motor speed to microtubule growth speed is a control parameter in our model; it captures the spatial distribution of motor crosslinks on microtubules.
Figure 6
Figure 6
Microtubule Minus-End-Directed Motor HSET Organizes Asymmetrically Growing Microtubules into Asters and Nematic Networks of Extensile Bundles (A and B) Confocal fluorescence microscopy images showing time course of (A) HSET-mediated organization of microtubule asters and of (B) a globally contracting microtubule network of CAMSAP3-C-nucleated microtubules at the indicated protein concentrations. (C) Scheme showing inverted microtubule growth asymmetry in the presence of microtubule plus-end capper DARPin (D1)2. (D) Kymographs showing fast microtubule minus-end growth using Alexa546-EB3 to visualize microtubule ends growing at 60 μM tubulin from GMPCPP-stabilized microtubule “seeds” (left) or of spontaneously nucleated microtubules (right) in the presence of 2.9 μM DARPin (D1)2. (E) Microtubule growth speed distribution in the absence (top) and presence (bottom) of 2.9 μM DARPin (D1)2 at 60 μM tubulin. Number of microtubule growth episodes measured: without DARPin (D1)2, 271; with DARPin (D1)2, 328. (F) Confocal fluorescence microscopy images showing time course of mCherry-HSET-mediated organization of microtubules with inverted growth asymmetry into networks of extensile bundles in the presence of 2.9 μM DARPin (D1)2 at 60 μM tubulin. mCherry-HSET concentration was 100 nM. Temperature was 33°C. See also Figure S7 and Video S6.
Figure S7
Figure S7
Microtubule Growth Episode Lengths in the Presence of DARPin and HSET Motor Speeds, Related to Figure 6 (A) Scatterplot depicting microtubule growth episode lengths at 60 μM tubulin in the presence of 2.9 μM DARPin (D1)2. Number of growth trajectories measured – 158. Horizontal lines indicate the mean and the standard deviation. (B) Box-and-whiskers plot depicting the dependence of HSET-driven microtubule gliding speeds on the mCherry-HSET concentration used to immobilise the motor on the glass surface for gliding assays with GMPCPP-stabilized microtubules. These speeds agree with previously measured vertebrate kinesin-14 gliding speeds (Braun et al., 2017, Hentrich and Surrey, 2010). The boxes extend from 25th to 75th percentiles, the whiskers extend from 5th to 95th percentiles, and the mean value is plotted as a line in the middle of the box. Number of gliding episodes measured at different mCherry-HSET concentrations: 3.1 nM – 160, 12.5 nM – 102, 25 nM – 129, 100 nM – 108, 400 nM – 92. All experiments were carried out in self-organization buffer at 33°C.
Figure 7
Figure 7
Summarizing Scheme of the Rules of Active Network Self-Organization (A) Key molecular components and the organizational phase space defined by the two identified control parameters that determine the outcome of microtubule/motor network self-organization. (B) Relevance of the control parameter-based rules for normal bipolar spindle assembly in cells and their consequences for the characteristic shapes of defective spindles after motor inactivation.

Similar articles

Cited by

References

    1. Aguirre-Portolés C., Bird A.W., Hyman A., Cañamero M., Pérez de Castro I., Malumbres M. Tpx2 controls spindle integrity, genome stability, and tumor development. Cancer Res. 2012;72:1518–1528. - PubMed
    1. Alvarado J., Sheinman M., Sharma A., MacKintosh F.C., Koenderink G.H. Force percolation of contractile active gels. Soft Matter. 2017;13:5624–5644. - PubMed
    1. Atherton J., Jiang K., Stangier M.M., Luo Y., Hua S., Houben K., van Hooff J.J.E., Joseph A.P., Scarabelli G., Grant B.J. A structural model for microtubule minus-end recognition and protection by CAMSAP proteins. Nat. Struct. Mol. Biol. 2017;24:931–943. - PMC - PubMed
    1. Baumann H., Surrey T. Motor-mediated cortical versus astral microtubule organization in lipid-monolayered droplets. J. Biol. Chem. 2014;289:22524–22535. - PMC - PubMed
    1. Belmonte J.M., Leptin M., Nédélec F. A theory that predicts behaviors of disordered cytoskeletal networks. Mol. Syst. Biol. 2017;13:941. - PMC - PubMed

Publication types