. 2018 Oct 26:8:236-249.
doi: 10.1016/j.isci.2018.09.018. Epub 2018 Sep 25.

p73 Is Required for Ovarian Follicle Development and Regulates a Gene Network Involved in Cell-to-Cell Adhesion

Affiliations

p73 Is Required for Ovarian Follicle Development and Regulates a Gene Network Involved in Cell-to-Cell Adhesion

Gabriela L Santos Guasch et al. iScience. .

Abstract

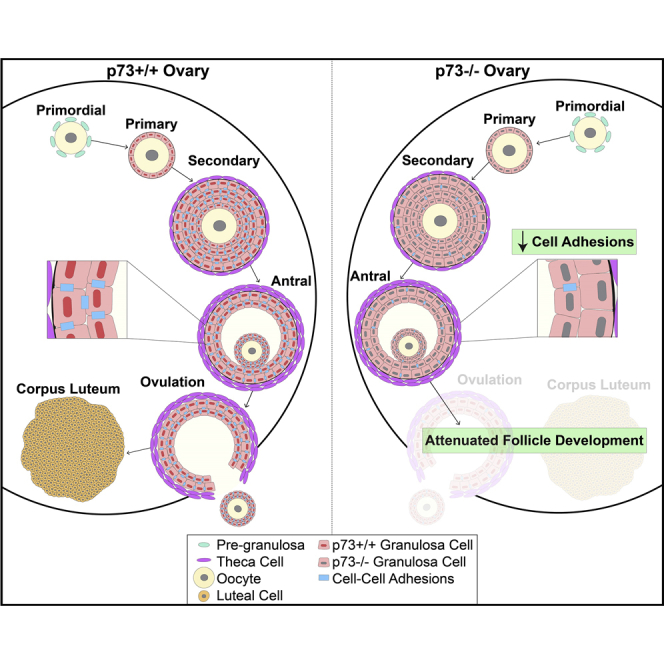
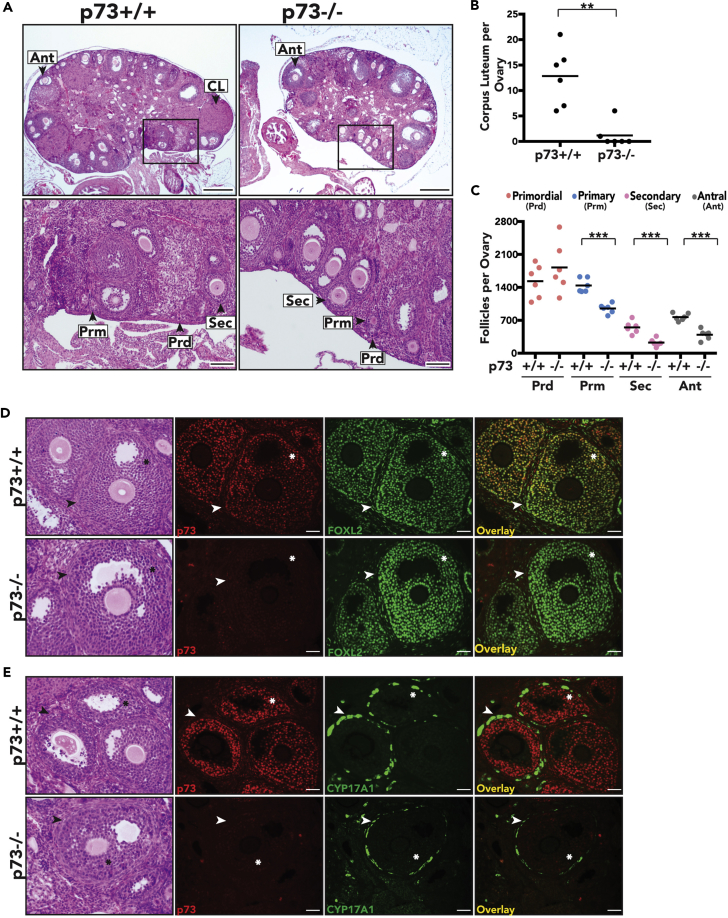
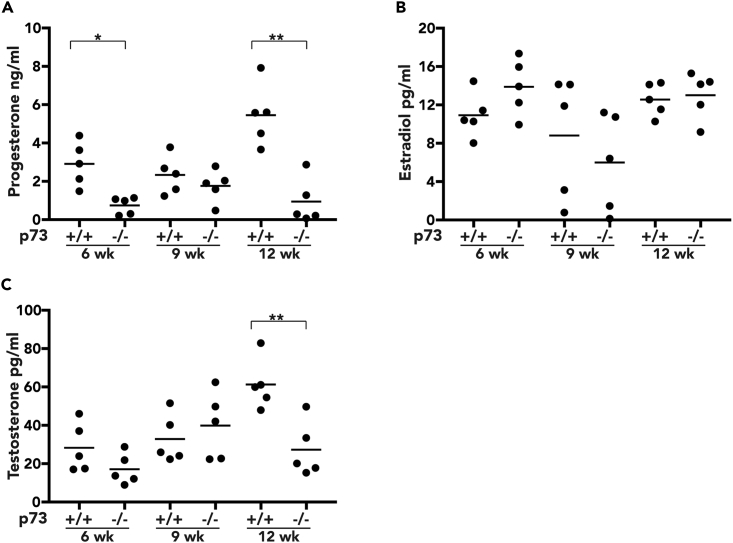
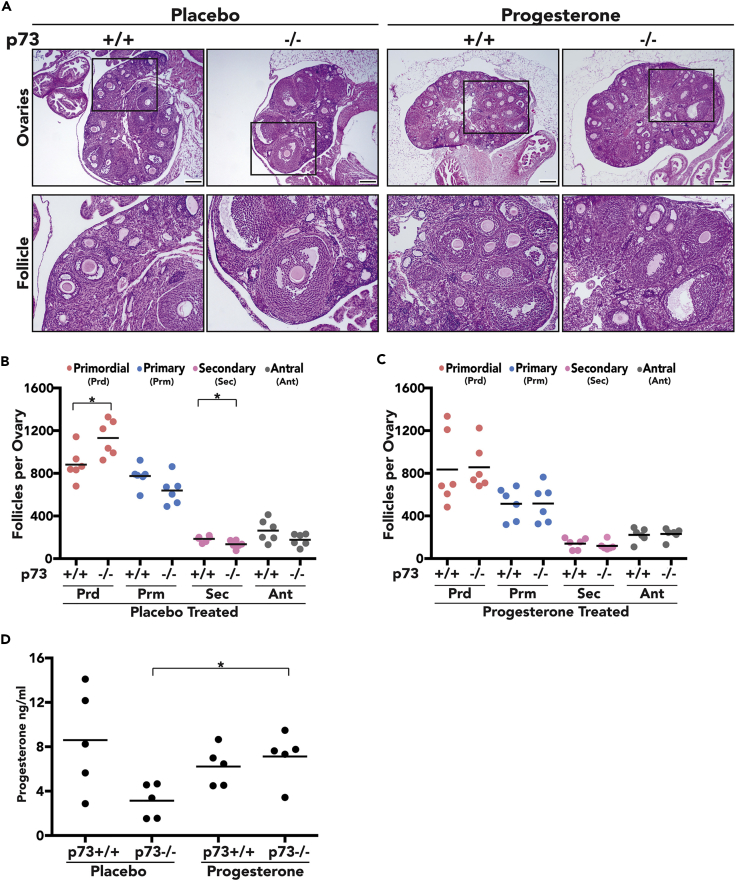
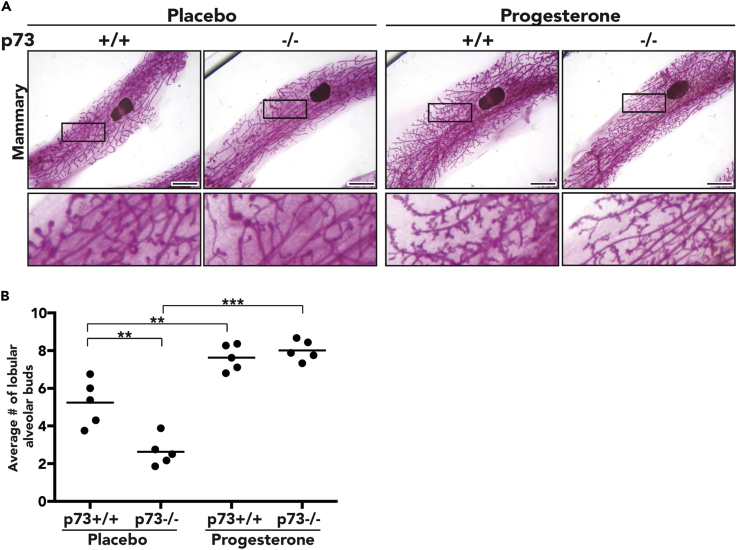
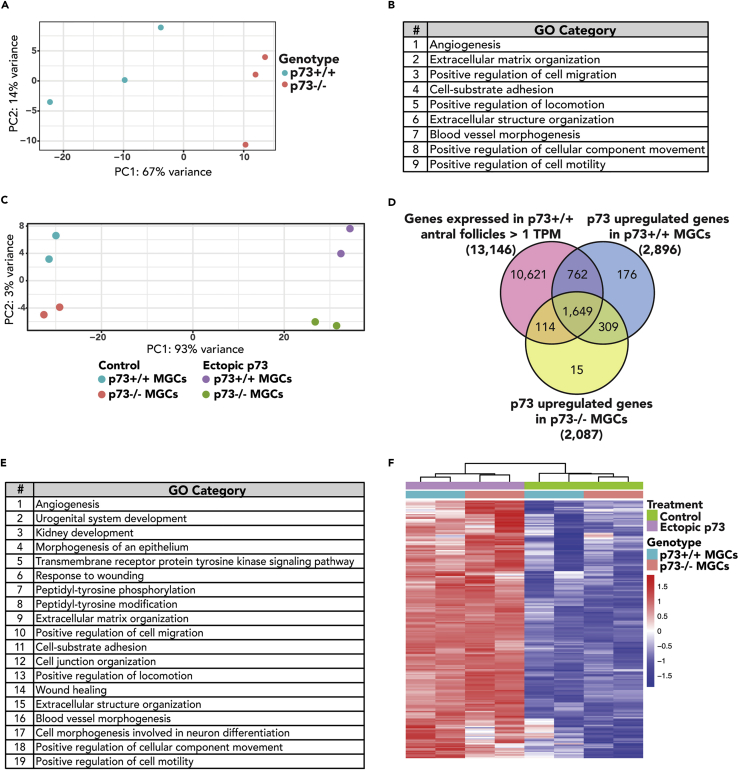
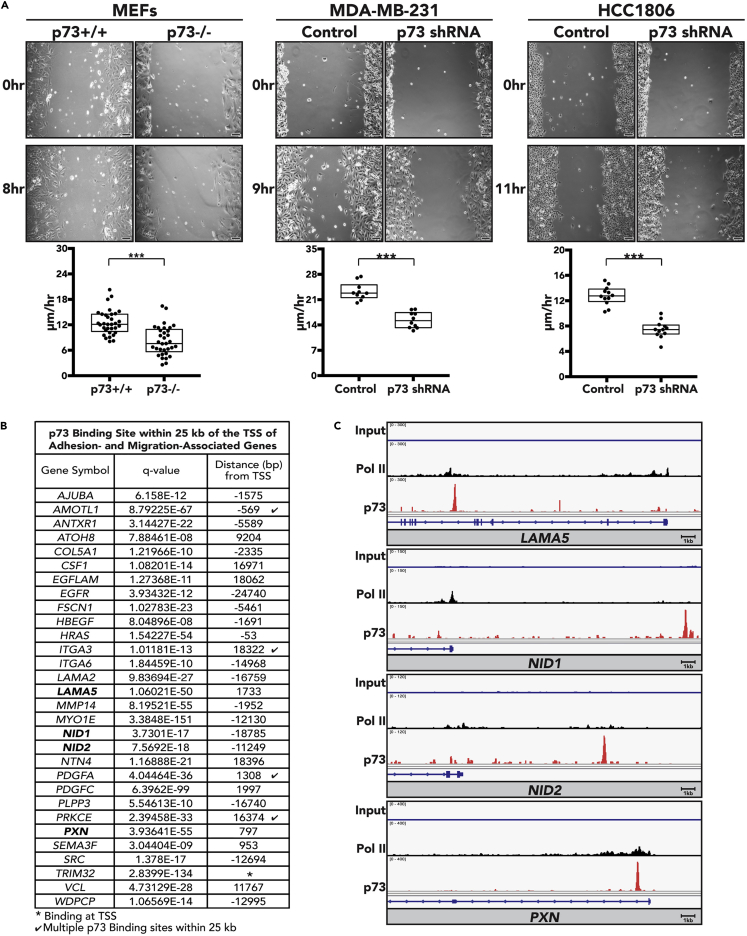
We report that p73 is expressed in ovarian granulosa cells and that loss of p73 leads to attenuated follicle development, ovulation, and corpus luteum formation, resulting in decreased levels of circulating progesterone and defects in mammary gland branching. Ectopic progesterone in p73-deficient mice completely rescued the mammary branching and partially rescued the ovarian follicle development defects. Performing RNA sequencing (RNA-seq) on transcripts from murine wild-type and p73-deficient antral follicles, we discovered differentially expressed genes that regulate biological adhesion programs. Through modulation of p73 expression in murine granulosa cells and transformed cell lines, followed by RNA-seq and chromatin immunoprecipitation sequencing, we discovered p73-dependent regulation of a gene set necessary for cell adhesion and migration and components of the focimatrix (focal intra-epithelial matrix), a basal lamina between granulosa cells that promotes follicle maturation. In summary, p73 is essential for ovarian folliculogenesis and functions as a key regulator of a gene network involved in cell-to-cell adhesion and migration.

Keywords: Developmental Biology; Functional Aspects of Cell Biology; Molecular Network; Omics.


Figures

None
Graphical abstract
Figure 1
Figure 1
p73 Is Required for Murine Ovarian Follicle Development (A) Representative H&E images of p73+/+ and p73−/− ovaries (scale bars, 400 μm and 100 μm, respectively). Arrowheads and labels represent corpora lutea (CL) and different stages of follicle development: Prd, primordial; Prm, primary; Sec, secondary; Ant, antral follicles. (B and C) Each data point represents the average of two independent manual quantifications of six ovaries per genotype. Bars represent the mean. (B) Total number of corpus luteum per ovary (C) Total number of follicles per ovary. **p value< 0.01, ***p value < 0.001. (D and E) Representative H&E (asterisks represent granulosa cells and arrowheads represent theca cells) and IF images of p73+/+ and p73−/− ovaries show that (D) p73 (red) co-localizes with granulosa cell marker FOXL2 (green) in the follicles and (E) p73 (red) is not expressed in theca cells, which are stained by CYP17A1 (green) (scale bar, 50 μm). See also Figure S1.
Figure 2
Figure 2
Analysis of Circulating Progesterone in p73+/+ and p73−/− Female Mice Plasma levels measure by ELISA of (A) progesterone, (B) estradiol, and (C) testosterone from five female mice per genotype at 6, 9, and 12 weeks of age; assay sensitivity range 0.2–50 ng/mL, 1–100 pg/mL, and 5–100 pg/mL, respectively. Bars represent the mean. *p value < 0.05, **p value < 0.01. See also Figure S2.
Figure 3
Figure 3
Progesterone Rescues Follicle Development in p73-Deficient Ovaries Progesterone slow-release pellet or placebo control (15 mg/pellet, 60-day extended release) were implanted in five female mice per genotype at 5 weeks of age. (A) Representative H&E images of placebo control and ectopic progesterone-treated ovaries of p73+/+ and p73−/− mice (scale bar, 200 μm). (B and C) (B) Follicle quantification of placebo control and (C) progesterone-treated p73+/+ and p73−/− ovaries, respectively. Data are shown as number of follicles per ovary; Prd, primordial; Prm, primary; Sec, secondary; Ant, antral. (D) Plasma levels of progesterone were measured through ELISA from placebo control and progesterone-treated p73+/+ and p73−/− female mice. *p value < 0.05. See also Figure S3.
Figure 4
Figure 4
Ectopic Progesterone Rescues Lobulo-Alveolar Budding Defect in p73-Deficient Mammary Gland (A) Whole mammary mount stained with carmine alum shows that ectopic progesterone rescues lobular-alveolar budding in p73−/− female mice (scale bar, 200 mm). (B) Lobulo-alveolar budding quantification of placebo control or progesterone from p73+/+ and p73−/−; values shown represent the average number of side branches per primary branch. **p value< 0.01, ***p value < 0.001. See also Figure S4.
Figure 5
Figure 5
p73 Regulates a Gene Network Involved in Biological Adhesions in Antral Follicles (A) Principal component analysis (PCA) plot of RNA sequencing (RNA-seq) analysis from LCM-isolated p73+/+ and p73−/− antral follicles (n = 3 mice/genotype). (B) Table shows top nine GO categories enriched in p73+/+ versus p73−/− antral follicles (FDR < 2.22 × 10−16). (C) PCA plot of RNA-seq analysis from p73+/+ and p73−/− MGCs after ectopic p73 or control. (D) Venn diagram showing the overlap between genes expressed in p73+/+ antral follicles (TPM > 1) and upregulated after ectopic p73 expression in p73+/+ and p73−/− MGCs. (E) Table listing the top 19 GO categories enriched in 1,649 overlapping genes from (D). (F) Heatmap of expression for core 208 p73-upregulated granulosa cell genes. These genes were selected by identifying the 1,649 genes in (D) that were present in three or more of the enriched GO categories from (E) (FDR p value < 0.1). See also Figure S5 and Tables S1, S2, S3, S4, S5 and S6.
Figure 6
Figure 6
p73 Regulates Cell Migration (A) MEFs isolated from p73+/+ and p73−/− mice, MDA-MB-231, and HCC1806 cells stably expressing control short hairpin RNA (shRNA) and p73 shRNA were plated in culture dishes containing magnetic stencils and grown to confluency (scale bar, 100 μm). Each dot represents the percentage gap closure per field of view. ***p value < 0.001. (B) Table listing adhesion- and migration-associated genes from the core set of 208 genes bound by p73 within 25 kb of their TSS (in HCC1806 cells). For each gene, the q value of the nearby p73 peak and its distance from the TSS of the gene are included. (C) Integrative Genomics Viewer images for selected genes from (B) with tracks for input, p73, and Pol II ChIP-seq in HCC1806 cells. Each sample was normalized to 1X depth of coverage. Individual tracks within a gene are scaled equally. RefSeq gene annotations are in blue schematics at the bottom of each panel on the same scale as the ChIP-seq tracks. See also Figures S6 and S7 and Table S7.

Similar articles

Cited by

References

    1. Allen W.M. The chemical and physiological properties, and clinical uses of the corpus luteum hormone, progesterone. Bull. N. Y. Acad. Med. 1941;17:508–518. - PMC - PubMed
    1. Ashby W.J., Wikswo J.P., Zijlstra A. Magnetically attachable stencils and the non-destructive analysis of the contribution made by the underlying matrix to cell migration. Biomaterials. 2012;33:8189–8203. - PMC - PubMed
    1. Bae W.K., Hong C.S., Park M.R., Sun E.G., Lee J.H., Kang K., Ryu K.H., Shim H.J., Hwang J.E., Cho S.H., Chung I.J. TAp73 inhibits cell invasion and migration by directly activating KAI1 expression in colorectal carcinoma. Cancer Lett. 2018;415:106–116. - PubMed
    1. Barak Y., Juven T., Haffner R., Oren M. mdm2 expression is induced by wild type p53 activity. EMBO J. 1993;12:461–468. - PMC - PubMed
    1. Barbareschi M., Pecciarini L., Cangi M.G., Macri E., Rizzo A., Viale G., Doglioni C. p63, a p53 homologue, is a selective nuclear marker of myoepithelial cells of the human breast. Am. J. Surg. Pathol. 2001;25:1054–1060. - PubMed

LinkOut - more resources