. 2018 Dec:33:100-109.
doi: 10.1016/j.scr.2018.10.015. Epub 2018 Oct 10.

Derivation and characterization of putative craniofacial mesenchymal progenitor cells from human induced pluripotent stem cells

Affiliations

Derivation and characterization of putative craniofacial mesenchymal progenitor cells from human induced pluripotent stem cells

Mohamed Jamal et al. Stem Cell Res. 2018 Dec.

Abstract

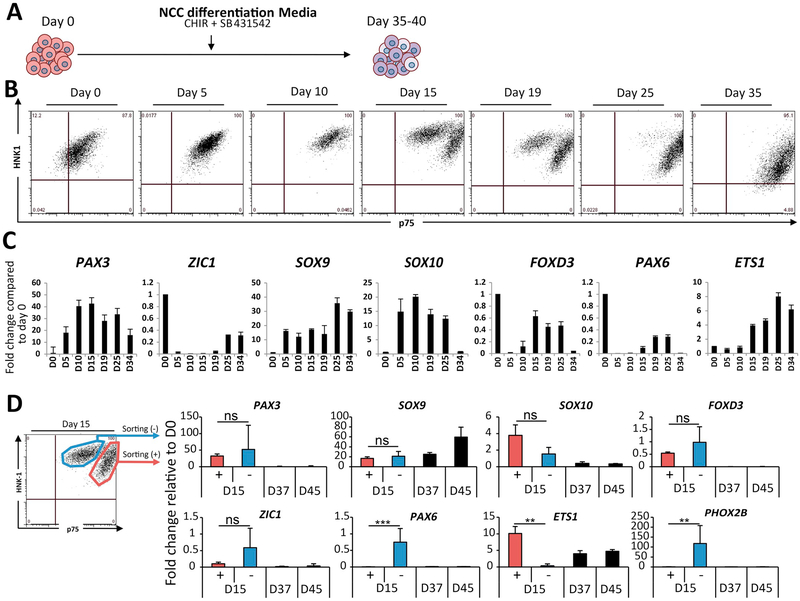
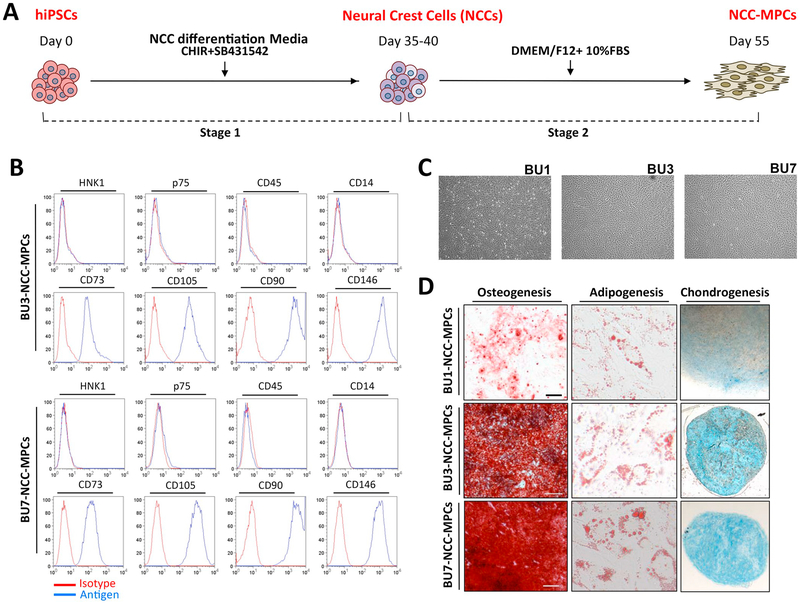
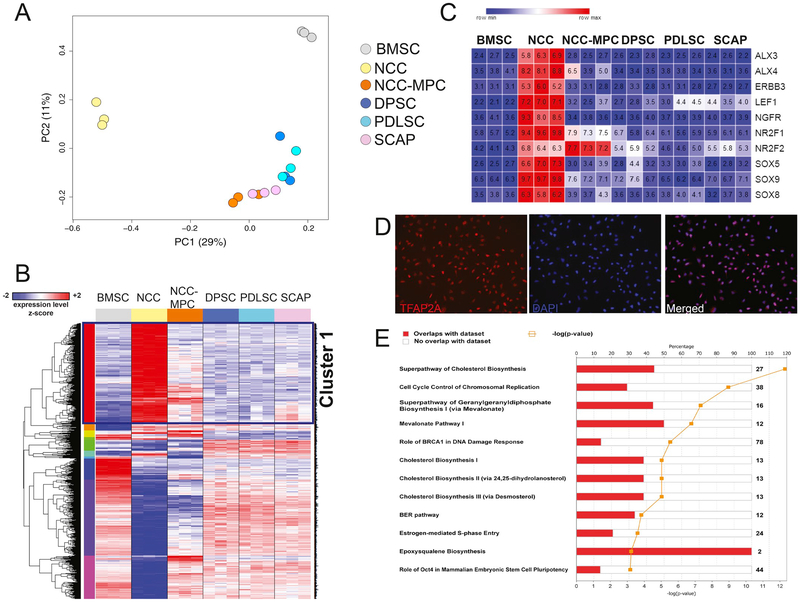
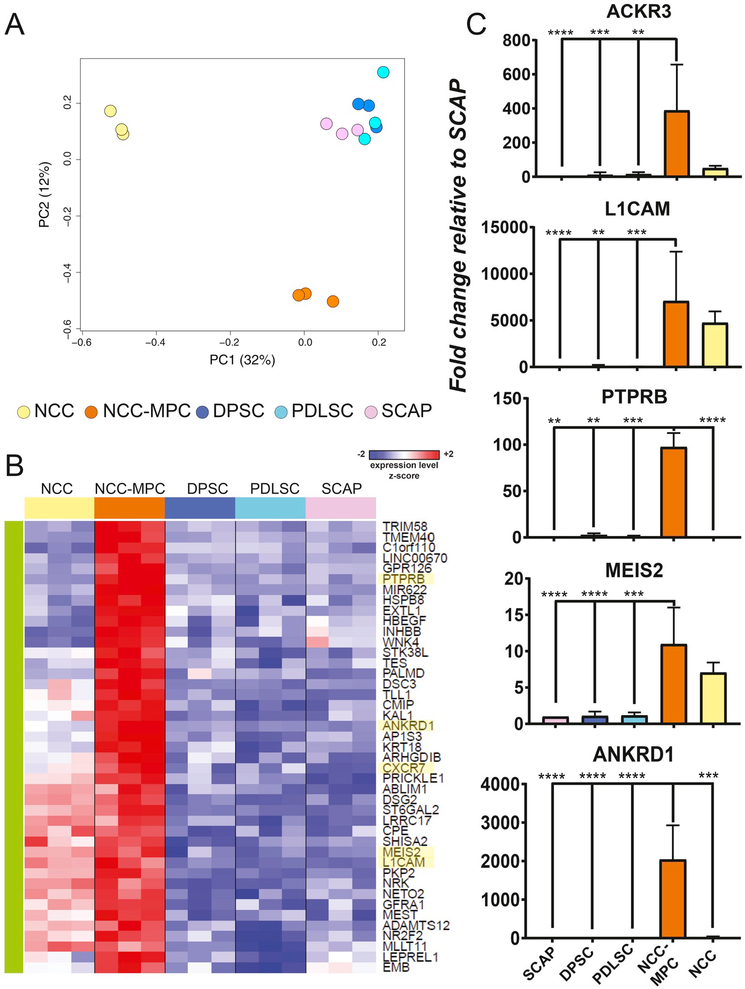
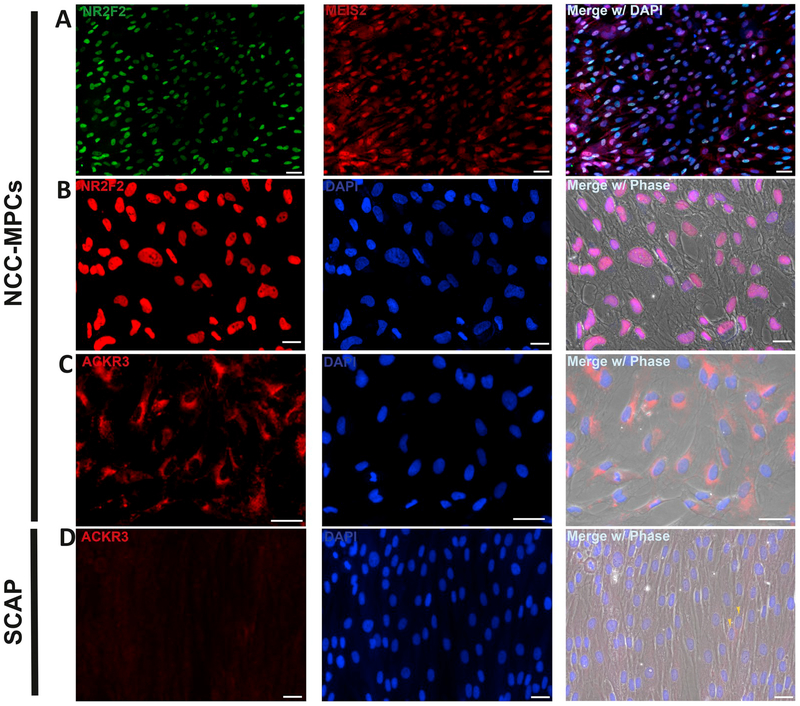
The introduction and widespread adoption of induced pluripotent stem cell (iPSC) technology has opened new avenues for craniofacial regenerative medicine. Neural crest cells (NCCs) are the precursor population to many craniofacial structures, including dental and periodontal structures, and iPSC-derived NCCs may, in the near future, offer an unlimited supply of patient-specific cells for craniofacial repair interventions. Here, we used an established protocol involving simultaneous Wnt signaling activation and TGF-β signaling inhibition to differentiate three human iPSC lines to cranial NCCs. We then derived a mesenchymal progenitor cell (NCC-MPCs) population with chondrogenic and osteogenic potential from cranial NCCs and investigated their similarity to widely studied human postnatal dental or periodontal stem/progenitor cells. NCC-MPCs were quite distinct from both their precursor cells (NCCs) and bone-marrow mesenchymal stromal cells, a stromal population of mesodermal origin. Despite their similarity with dental stem/progenitor cells, NCC-MPCs were clearly differentiated by a core set of 43 genes, including ACKR3 (CXCR7), whose expression (both at transcript and protein level) appear to be specific to NCC-MPCs. Altogether, our data demonstrate the feasibility of craniofacial mesenchymal progenitor derivation from human iPSCs through a neural crest-intermediate and set the foundation for future studies regarding their full differentiation repertoire and their in vivo existence.


Conflict of interest statement

Conflicts of interest

The authors declare that they do not have any conflicts of interest.

Figures

Fig. 1.
Fig. 1.
Derivation and characterization of putative NCCs from BU3 hiPSCs. (A) Differentiation protocol for the derivation of putative NCCs from hiPSCs showing the added factors and the duration of the differentiation. (B) Bivariate flow cytometry dot plots demonstrating the temporal expression patterns of HNK1 and p75 in the course of NCC differentiation (D0-D35). (C) Kinetics of NCC and neuronal marker expression by RT-qPCR. Fold changes are calculated relative to D0 undifferentiated hiPSCs. Error bars represent standard deviation (N = 3). (D) Schematic showing the sorting of two populations p75(+) (p75bright) and p75(−) (p75dim) on D15 of NCC differentiation (left panel). Transcriptional analysis by RT-qPCR of NCC- and neuronal-related genes of the sorted populations on D15 as well as of p75bright populations on D37 and D45. Error bars represent standard deviation (N = 3).
Fig. 2.
Fig. 2.
Derivation of NCC-MPCs from hiPSCs through a cranial NCC intermediate. (A) Differentiation protocol showing the multi-step derivation of NCC-MPCs from hiPSCs. (B) Flow cytometry histograms depicting the expression levels of various neural crest, stromal and hematopoietic cell surface markers in NCC-MPCs after three passages. Data are shown for two hiPSC lines (BU3 and BU7). The red line indicates staining with an isotype control for each antibody. (C) Phase contrast micrographs of near confluent NCC-MPCs derived from three hiPSC lines. (D) Brightfield micrographs of NCC-MPCs derived from three hiPSC lines following incubation in osteogenic, adipogenic and chondrogenic media. Calcium deposition indicating osteogenic differentiation was detected by Alizarin Red staining (left panel), oil droplets indicating adipogenic differentiation were detected by Oil Red O staining (middle panel) and glucosaminoglycans indicating chondrogenic differentiation were detected by Alcian Blue staining (right panel).
Fig. 3.
Fig. 3.
Genome-wide transcriptomic analysis of hiPSC-derived NCCs and NCC-MPCs. (A) Principal component analysis (PCA) plot of microarray populations (NCCs, NCC-MPCs and dental stem/progenitor cell populations). The x and y axes depict the PC1 and PC2, respectively. (B)Microarray heat map: the heat map shows the top differentially expressed genes (1327 genes, FDR < 10−6, |fold change| > 4) across all groups (NCCs, NCCMPCs, DPSCs, PDLSCs, SCAP and BMSCs) clustered by samples in triplicate (columns) and expression clusters (rows). Cluster 1 that differentiates NCCs from all other populations is indicated on the right. The log2 (expression) values for each gene were z-score-normalized to a mean of zero and standard deviation of 1 across all samples in each row; blue and red indicate z-scores less than −2 or > 2, respectively, and white indicates a z-score of 0 (row-wise mean). (C) Heat map showing differential gene expression of select NCC-related genes across the same groups as in (B). (D) Fluorescence micrographs of NCC culture (BU1 hiPSC line) stained for TFAP2A. (E) Top pathways of the Cluster 1 genes derived from Ingenuity Pathway Analysis. Cutoff p-value = 10−3.
Fig. 4.
Fig. 4.
Transcriptional signature of NCC-MPCs. (A) PCA plot of all populations without BMSCs. The x and y axes depict the PC1 and PC2, respectively. (B) Enlarged view of Cluster 3 of the heat map in Fig. S4C. This cluster contains 43 genes (FDR < 10−6, |fold change| > 4). The log2 (expression) values for each gene were z-score-normalized to a mean of zero and standard deviation of 1 across all samples in each row; blue and red indicate z-scores less than −2 or > 2, respectively, and white indicates a z-score of 0 (row-wise mean). (C) RT-qPCR validation of five genes contained in (B). Fold changes are calculated relative to SCAP. Error bars represent standard deviation (N = 3). **: p < .01, ***: p < .001, ****: p < .0001.
Fig. 5.
Fig. 5.
NCC-MPCs co-express ACKR3, MEIS2 and NR2F2. Representative fluorescent micro-graphs of NCC-MPCs stained for (A) NR2F2 and MEIS2 (B) NR2F2, and (C) ACKR3 (CXCR7) and of SCAP stained for (D) ACKR3 (CXCR7). Arrowheads indicate two cells with low ACKR3 expression. Scale bar, 50 μm for (A), (C) and (D), 30 μm for (B).

Similar articles

Cited by

References

    1. Ahlgren SC, Bronner-Fraser M, 1999. Inhibition of Sonic hedgehog signaling in vivo results in craniofacial neural crest cell death. Curr. Biol 9, 1304–1314. - PubMed
    1. Benjamini Y, Hochberg Y, 1995. Controlling the false discovery rate - a practical and powerful approach to multiple testing. J. R. Stat. Soc. Ser. B-Methodol 57, 289–300.
    1. Beverdam A, Brouwer A, Reijnen M, Korving J, Meijlink F, 2001. Severe nasal clefting and abnormal embryonic apoptosis in Alx3/Alx4 double mutant mice. Development 128, 3975–3986. - PubMed
    1. Brainarray, 2017. Description of Customized CDF Files Retrieved October 20 2017, from. http://brainarray.mbni.med.umich.edu/Brainarray/Database/CustomCDF.
    1. Brettschneider J, Collin F, Bolstad BM, Speed TP, 2008. Quality assessment for short oligonucleotide microarray data. Technometrics 50, 241–264.

Publication types

MeSH terms