

The biomass-density relationship in seagrasses and its use as an ecological indicator
- PMID: 30340566
- PMCID: PMC6195692
- DOI: 10.1186/s12898-018-0200-1
The biomass-density relationship in seagrasses and its use as an ecological indicator
Abstract
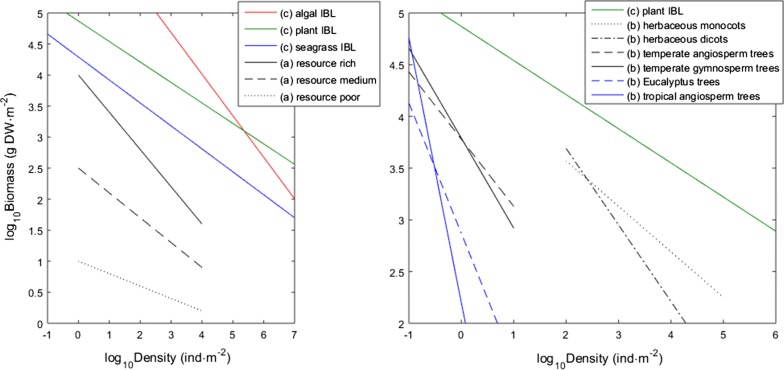
Background: Biomass-density relations have been at the centre of a search for an index which describes the health of seagrass meadows. However, this search has been complicated by the intricacy of seagrass demographics and their complex biomass-density relations, a consequence mainly of their modular growth and clonality. Concomitantly, biomass-density upper boundaries have been determined for terrestrial plants and algae, reflecting their asymptotic maximum efficiencies of space occupation. Each stand's distance to its respective biomass-density upper boundary reflects its effective efficiency in packing biomass, which has proved a reliable ecological indicator in order to discriminate between taxonomic groups, functional groups and clonal vs. non-clonal growth.
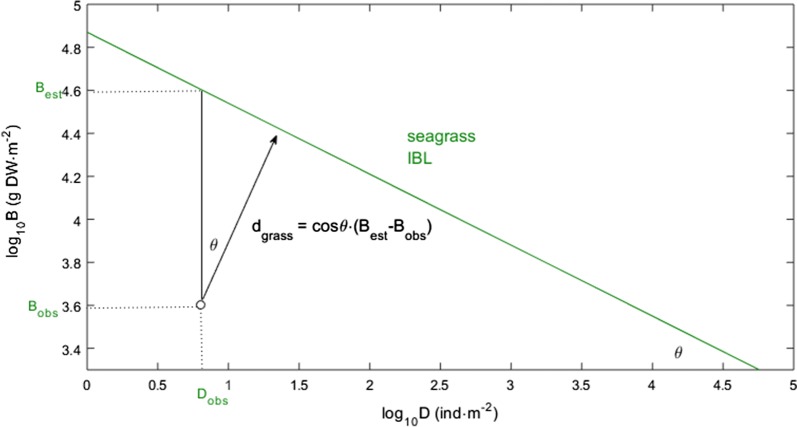
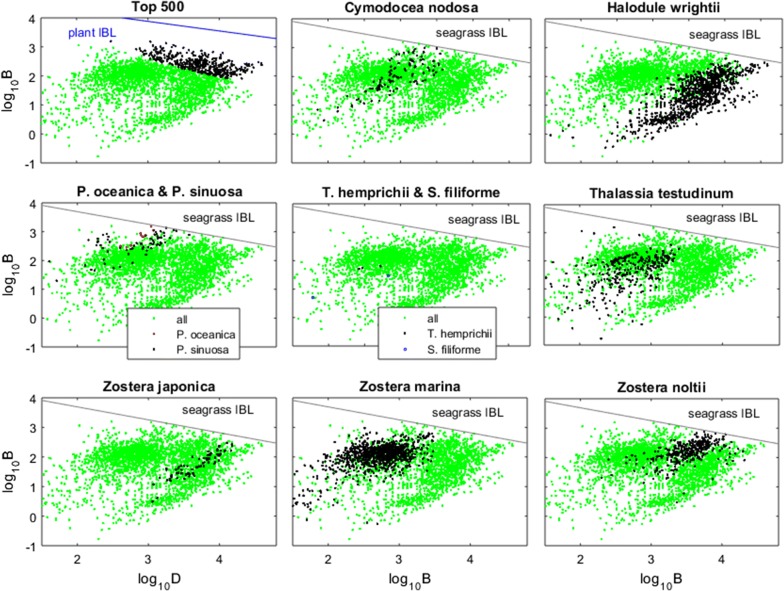
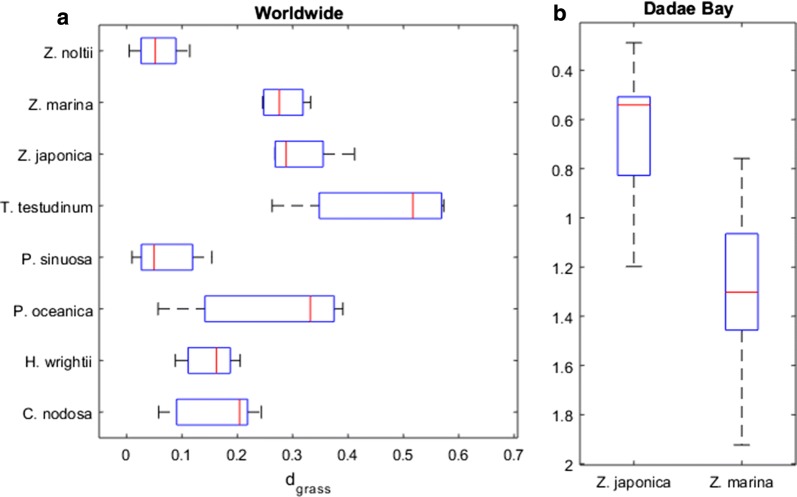
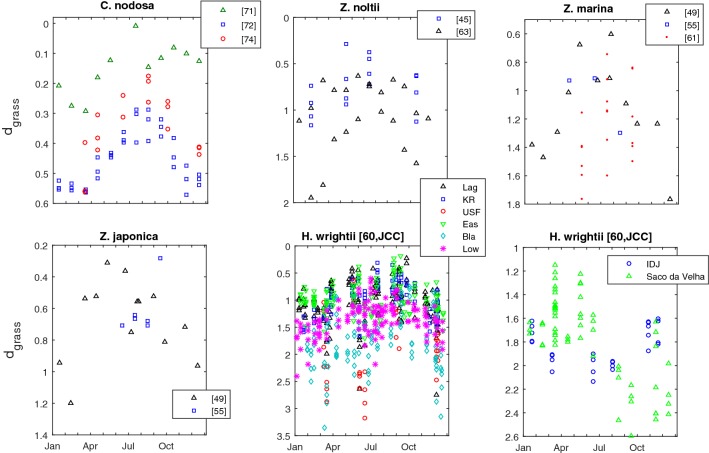
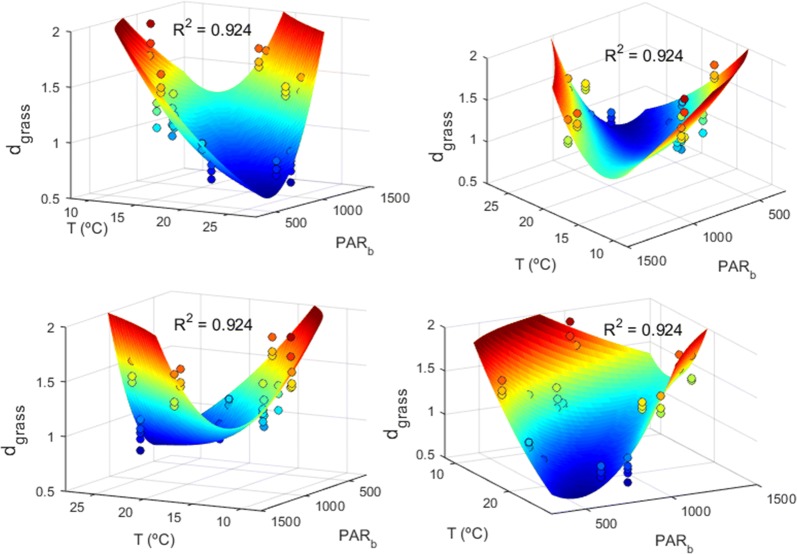
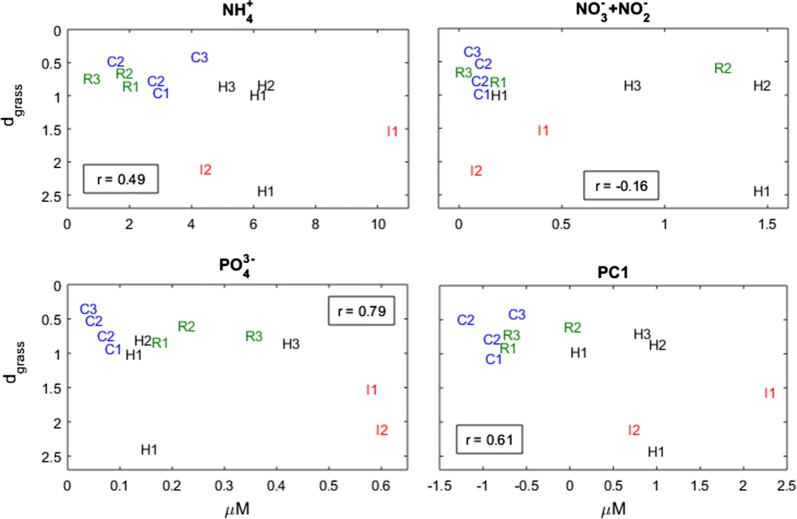
Results: We gathered data from 32 studies on 10 seagrass species distributed worldwide and demonstrated that seagrasses are limited by their own boundary line, placed below the boundaries previously determined for algae and terrestrial plants. Then, we applied a new metric-dgrass: each stand's perpendicular distance to the seagrass boundary-and used this parameter to review fundamental aspects such as clonal growth patterns, depth distribution, seasonality, interspecific competition, and the effects of light, temperature and nutrients.
Conclusions: Seagrasses occupy space less efficiently than algae and terrestrial plants. Using only their biomass and density data we established a new and efficient tool to describe space occupation by seagrasses. This was used with success to evaluate their meadows as an ecological indicator for the health of coastal ecosystems.
Keywords: Coastal; Ecosystem; Index; Meadow; Nutrient; Pollution; Seagrass.
Figures


References
-
- Yoda K, Kira T, Ogawa H, Hozumi K. Self-thinning in overcrowded pure stands under cultivated and natural conditions (Intraspecific competition among higher plants. J Biol Osaka City Univ. 1963;14:107–129.
-
- Hutchings MJ. Ecology’s law in search of a theory. New Scientist. 1983;98:765–767.
-
- Cousens R, Hutchings MJ. The relationship between density and mean frond weight in monospecific seaweed stands. Nature. 1983;301:240–241. doi: 10.1038/301240a0. - DOI
-
- Lonsdale WM, Watkinson AR. Plant geometry and self-thinning. J Ecol. 1983;71(285–29):7.
-
- White J, Harper JL. Correlated change in plant size and number in plant populations. J Ecol. 1970;58:467–485. doi: 10.2307/2258284. - DOI
Publication types
MeSH terms
Grants and funding
- UID/EEA/50009/2013/Faculdade de Ciências e Tecnologia, Universidade Nova de Lisboa/International
- UID/EEA/50009/2013/Faculdade de Ciências e Tecnologia, Universidade Nova de Lisboa/International
- Ciências do Mar 1137/2010/Coordenação de Aperfeiçoamento de Pessoal de Nível Superior/International
- FAPERJ-E-26/111.574/2014/Fundação Carlos Chagas Filho de Amparo à Pesquisa do Estado do Rio de Janeiro/International
- E26/201.286/2014/Fundação Carlos Chagas Filho de Amparo à Pesquisa do Estado do Rio de Janeiro/International
LinkOut - more resources
Full Text Sources
