Review
. 2018 Oct 19;15(1):30.
doi: 10.1186/s12987-018-0113-6.

Elimination of substances from the brain parenchyma: efflux via perivascular pathways and via the blood-brain barrier

Affiliations
Review

Elimination of substances from the brain parenchyma: efflux via perivascular pathways and via the blood-brain barrier

Stephen B Hladky et al. Fluids Barriers CNS. .

Abstract

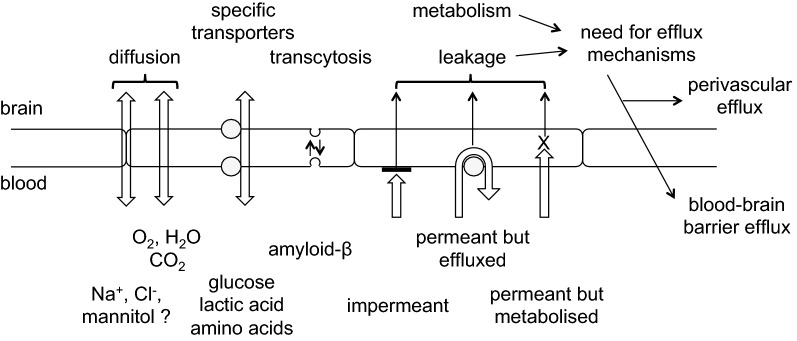
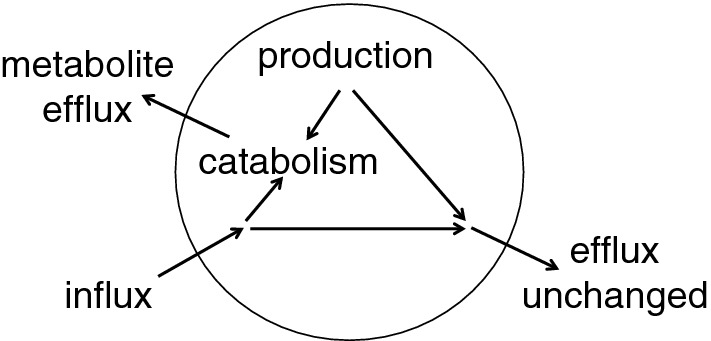
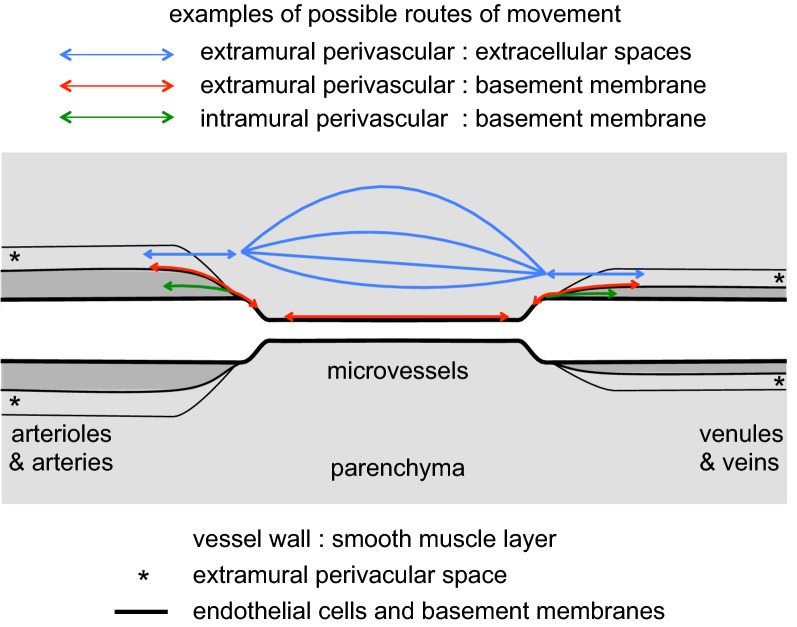
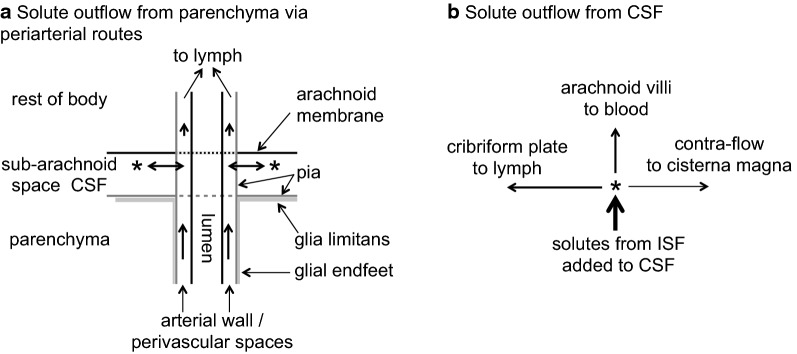
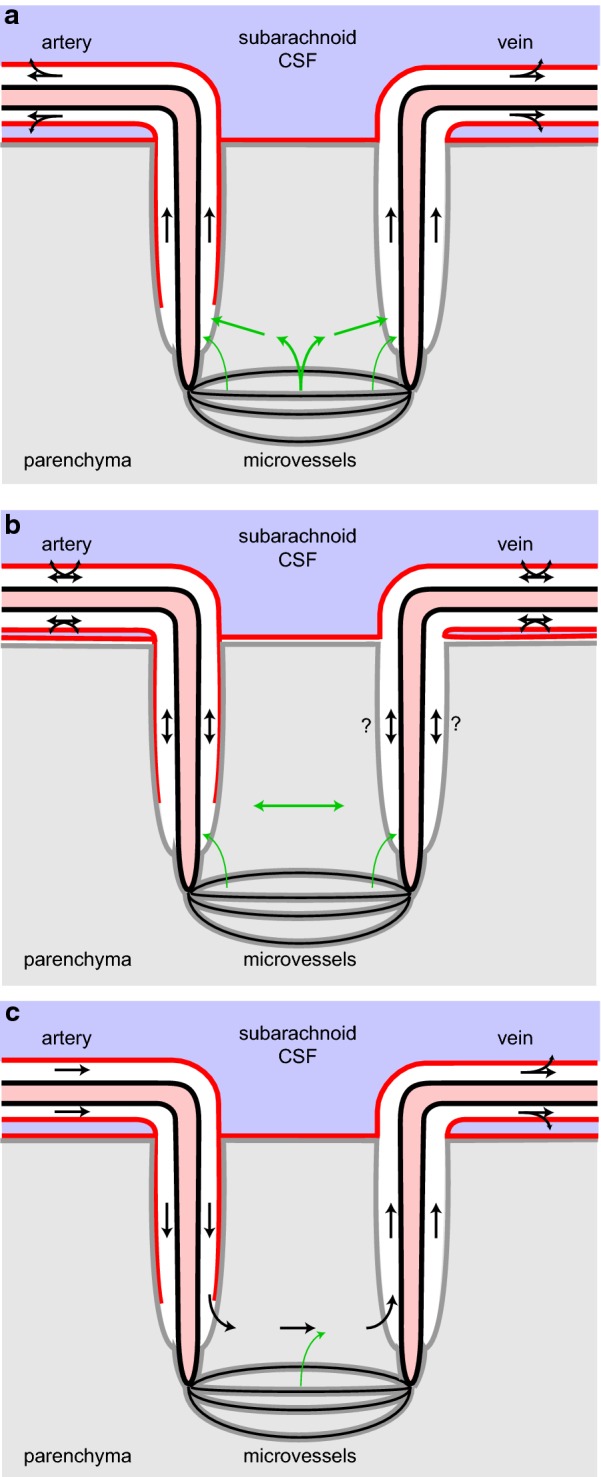
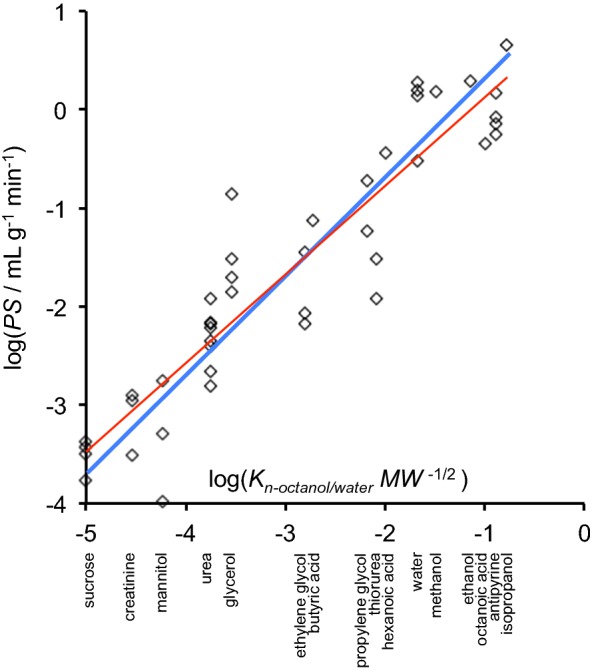
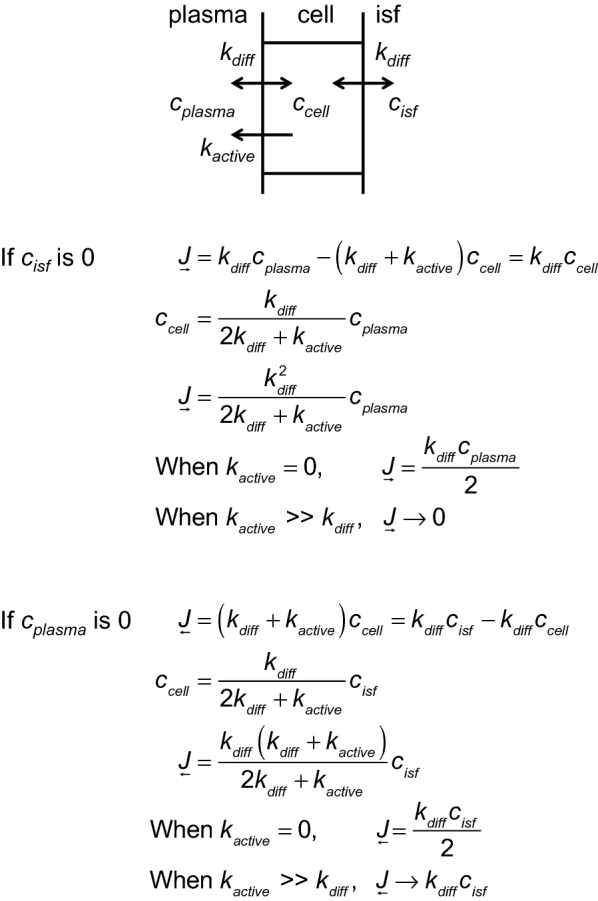
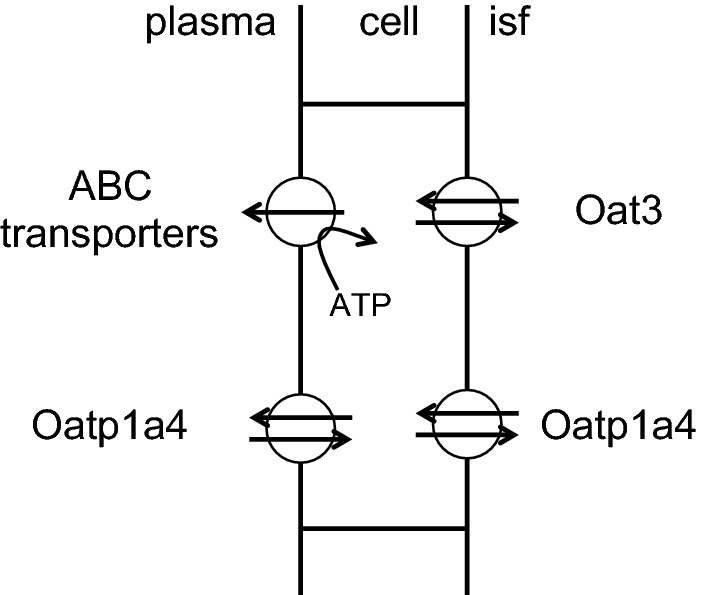
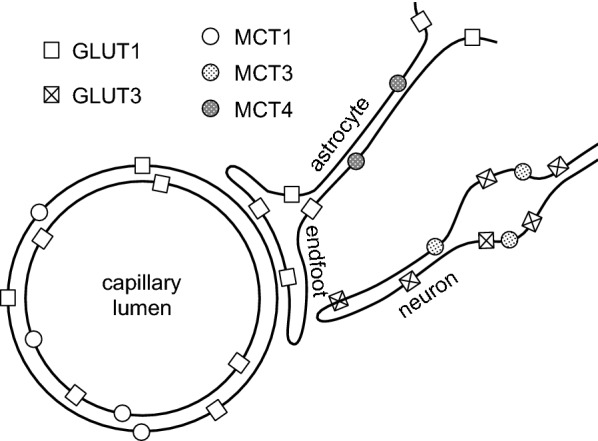
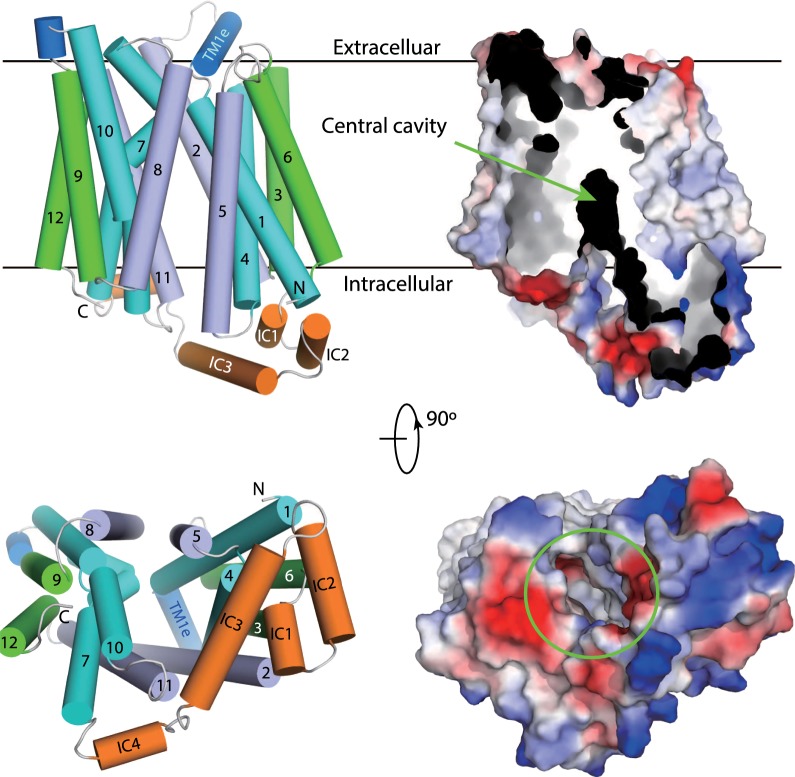
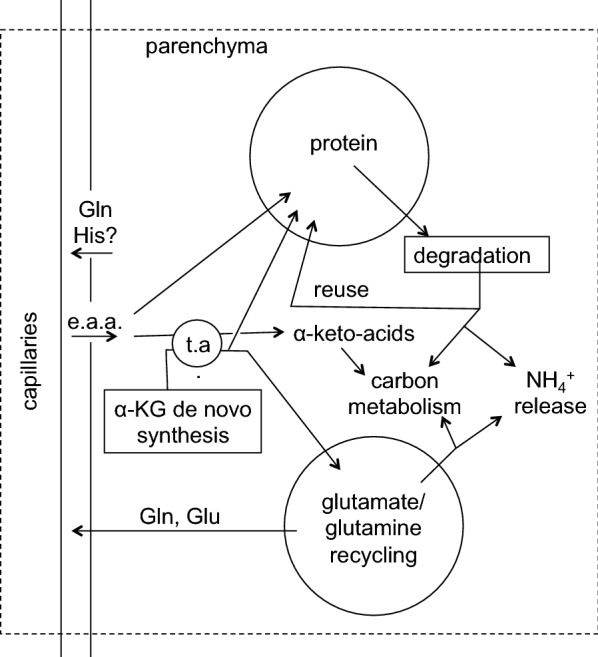
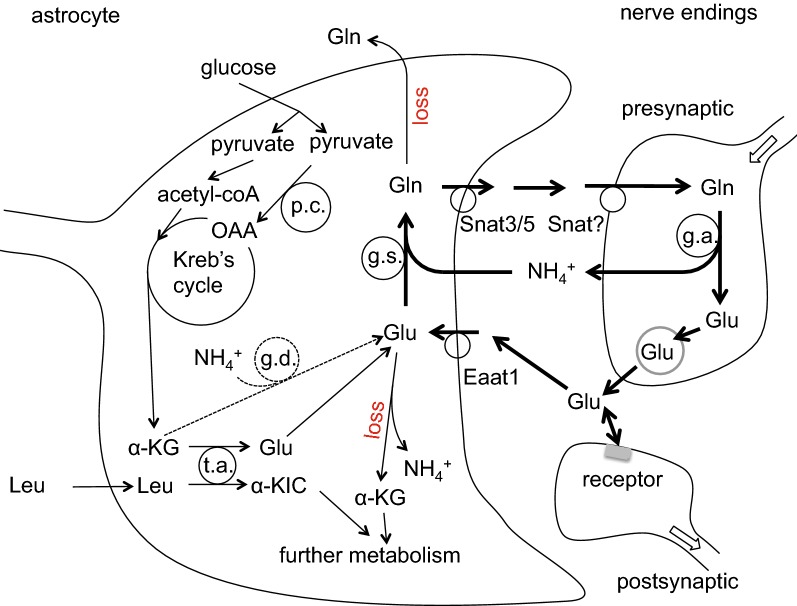
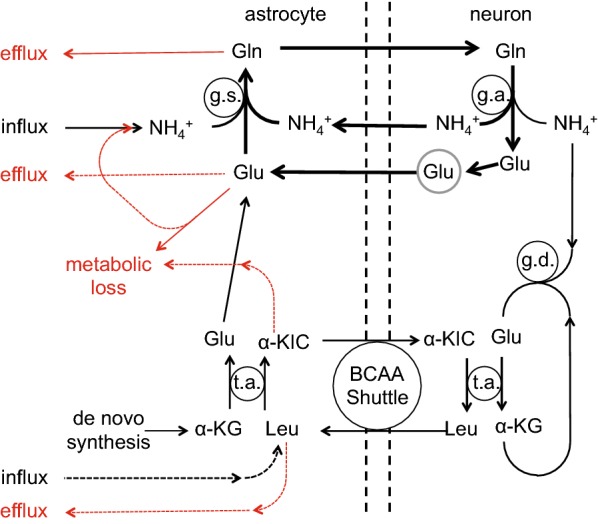
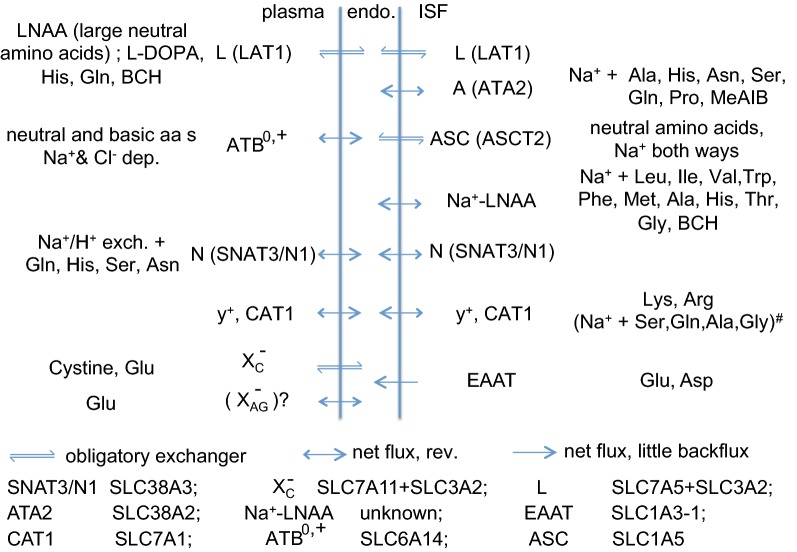
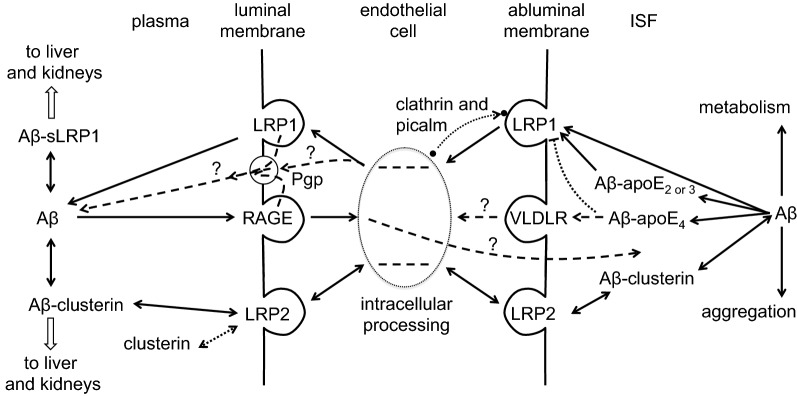
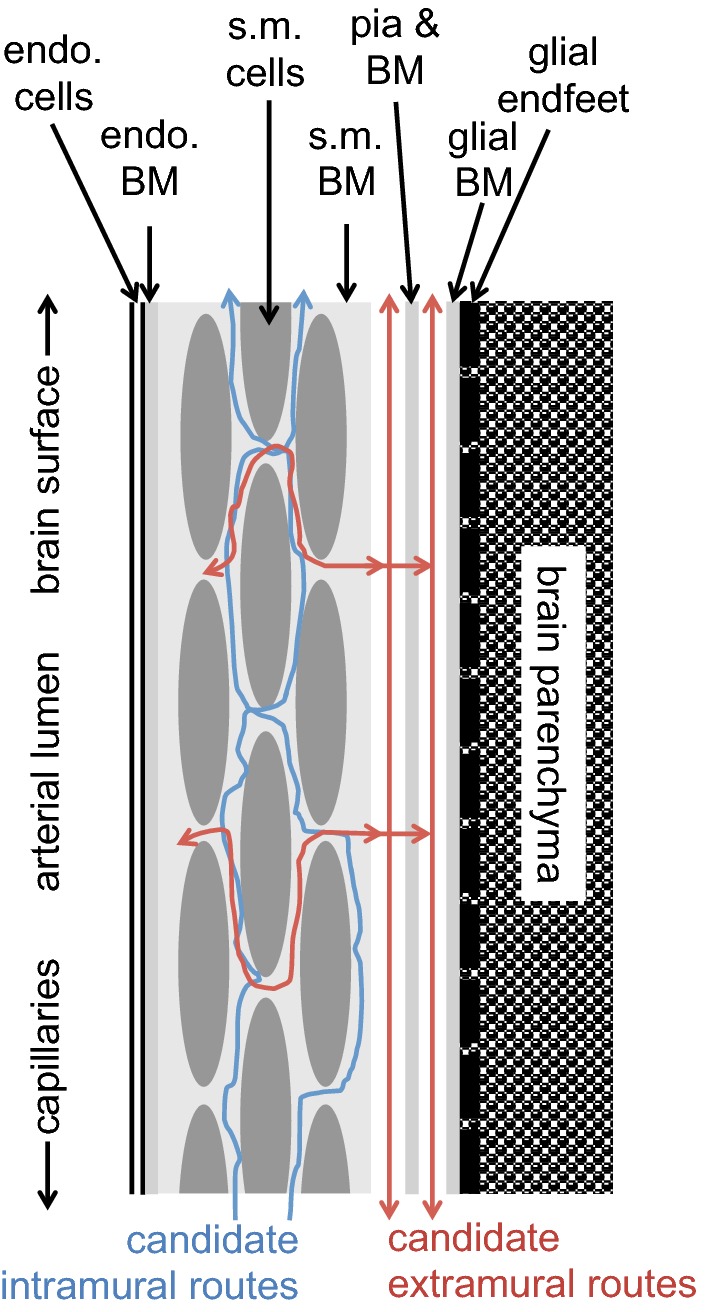
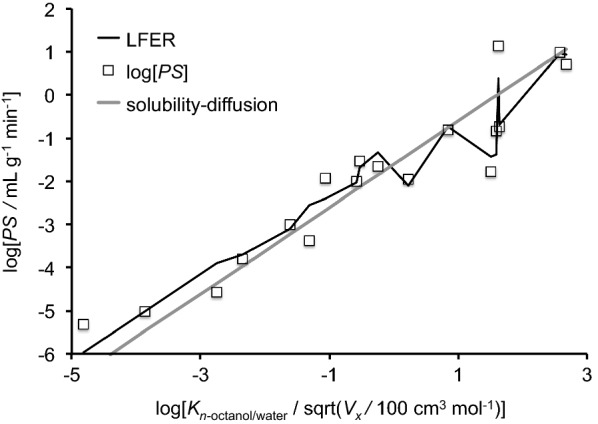
This review considers efflux of substances from brain parenchyma quantified as values of clearances (CL, stated in µL g-1 min-1). Total clearance of a substance is the sum of clearance values for all available routes including perivascular pathways and the blood-brain barrier. Perivascular efflux contributes to the clearance of all water-soluble substances. Substances leaving via the perivascular routes may enter cerebrospinal fluid (CSF) or lymph. These routes are also involved in entry to the parenchyma from CSF. However, evidence demonstrating net fluid flow inwards along arteries and then outwards along veins (the glymphatic hypothesis) is still lacking. CLperivascular, that via perivascular routes, has been measured by following the fate of exogenously applied labelled tracer amounts of sucrose, inulin or serum albumin, which are not metabolized or eliminated across the blood-brain barrier. With these substances values of total CL ≅ 1 have been measured. Substances that are eliminated at least partly by other routes, i.e. across the blood-brain barrier, have higher total CL values. Substances crossing the blood-brain barrier may do so by passive, non-specific means with CLblood-brain barrier values ranging from < 0.01 for inulin to > 1000 for water and CO2. CLblood-brain barrier values for many small solutes are predictable from their oil/water partition and molecular weight. Transporters specific for glucose, lactate and many polar substrates facilitate efflux across the blood-brain barrier producing CLblood-brain barrier values > 50. The principal route for movement of Na+ and Cl- ions across the blood-brain barrier is probably paracellular through tight junctions between the brain endothelial cells producing CLblood-brain barrier values ~ 1. There are large fluxes of amino acids into and out of the brain across the blood-brain barrier but only small net fluxes have been observed suggesting substantial reuse of essential amino acids and α-ketoacids within the brain. Amyloid-β efflux, which is measurably faster than efflux of inulin, is primarily across the blood-brain barrier. Amyloid-β also leaves the brain parenchyma via perivascular efflux and this may be important as the route by which amyloid-β reaches arterial walls resulting in cerebral amyloid angiopathy.

Keywords: ABC transporters; Amino acid metabolism; Basement membrane; Blood–brain barrier permeability; Branched chain amino acid shuttle; Carrier mechanism; Diffusion; Efflux rate constant; Linear free energy relations; Perivascular convection; SLC transporters; Trans-stimulation; Transcytosis; Volume of distribution.


Figures

Fig. 1
Fig. 1
Mid-saggital section of the brain showing locations of the ventricles, cerebral aqueduct, subarachnoid spaces (including the basal cisterns) and choroid plexuses. The choroid plexuses are discrete epithelial structures located in the cerebral ventricles that secrete cerebrospinal fluid (CSF) shown in pale blue, which fills the ventricles and subarachnoid spaces. Normally there is net flow of CSF from the ventricles into the cisterna magna and from there to the other subarachnoid spaces of the brain and spinal cord. Reproduced but relabelled with permission from Strazielle et al. [20]
Fig. 2
Fig. 2
Schematic diagrams of the lateral surface of the brain showing a the arterial supply and b the venous drainage with an inset indicating the relations of the pia, the ependyma and the perivascular spaces to the brain parenchyma. The large vessels run parallel to the surfaces of the brain, with smaller branches that penetrate into the parenchyma more or less perpendicular to the surfaces (see inset). Points of penetration of the vessels down into the parenchyma are indicated by black dots at the end of vessels. Branching of arteries continues within the parenchyma yielding arterioles and eventually capillaries that then join forming venules and then veins. These merge and drain into the large veins and venous sinuses on the surface. As discussed in the text blood vessels within the parenchyma have associated perivascular spaces that provide preferential routes for materials to enter and leave the parenchyma. Figure drawn by Robert G. Thorne and used with permission. See [639] for a succinct but still thorough description of human anatomy relevant to delivery of substances to the brain and their removal from it
Fig. 3
Fig. 3
Mechanisms for transfers into and out of the brain across the blood–brain barrier and the need for efflux mechanisms. Passive, non-specific transfers can occur via paracellular and transcellular routes, though the rates for paracellular transfer are small. Specific transcellular transport can be passive or active. In addition to the transfers for well-known substances many others are able to enter at various rates, either because they are sufficiently small and lipid-soluble or because barrier mechanisms are not perfect. Substances which enter even though they shouldn’t or are produced “accidentally” by metabolism cannot be allowed to accumulate within the brain. Thus there must be mechanisms for eliminating them
Fig. 4
Fig. 4
Elimination of unwanted substances can be either by efflux alone or it can be by metabolism followed by efflux of the metabolites
Fig. 5
Fig. 5
Diagram indicating putative perivascular routes for substances to move into, out of and through the brain parenchyma. The lumens of arteries, arterioles, venules and veins are surrounded by a layer of endothelial cells with a basement membrane, then a layer of vessel wall including smooth muscle, and outside that there may be a further perivascular space with fluid and connective tissue bounded by basement membranes of the smooth muscle, pial and glial cells. Close to the surfaces of the brain these further spaces are often called Virchow-Robin spaces. Movements parallel to the large vessels may be intramural, through the extracellular space of the vessel wall, or extramural either in the outermost basement membranes or, in the opinion of some workers, in a fluid filled space. In this review both intramural and extramural pathways are called perivascular routes. Parallel to microvessels movement may be preferentially within the basement membrane separating the endothelial cells from the glial endfeet or it may be more diffuse through the interstitial spaces between the parenchymal cells
Fig. 6
Fig. 6
Schematic diagram indicating possible routes for efflux of large solutes from the parenchyma along perivascular routes. a Large solutes emerging from the parenchyma via intramural or extramural routes along arteries (and possibly veins) may either mix with CSF or continue along the walls of blood vessels. The blood vessels span the subarachnoid space (see Figs. 1 and 6) before leaving the brain to reach the rest of the body. The fluid that continues along these vessels may enter either blood or lymph, but solutes as large as serum albumin will enter only lymph. b Large solutes that have reached CSF will be taken to sites of CSF outflow including the arachnoid villi, where the solutes will enter venous blood, and the cribriform plate, where they will enter lymph. (Based primarily on data for radio-iodinated serum albumin RISA [82, 83, 125] and on the location of the pia surrounding arteries taken from [103]). The anatomical relations of the pathways or spaces remain controversial
Fig. 7
Fig. 7
Proposals to explain rapid transfer of markers via periarterial spaces: a the original proposal; b proposed perivascular convection and interstitial diffusion c the glymphatic proposal. In a the blood–brain barrier secretes fluid which flows out of the parenchyma via preferred routes (here the perivascular routes). In b transport in the perivascular spaces is assisted by convective stirring or mixing. In c (see Figure 5 of Iliff et al. [25]) there is preferential inflow via the space between the arterial wall and the pial sheath and preferential outflow via spaces surrounding veins. Red lines represent pial membranes, grey lines the layer of glial end-feet or glia limitans, black arrows are fluxes of markers carried or assisted by convection, green arrows are primarily diffusion. The location of the pial barriers is based on Zhang et al. [23]. The anatomical basis of the perivascular spaces remains controversial (Modified from Figure 9 in [41])
Fig. 8
Fig. 8
Plot of log(PS/mL g−1 min−1), versus log(Kn-octanol/water MW−1/2) for the substances indicated along the abscissa. PS is the product of permeability and surface area for the blood–brain barrier, Kn-octanol/water is the octanol/water partition coefficient and MW is the molecular weight of the substance. The slope of 1 for the heavy blue line indicates PS proportional to Kn-octanol/water MW−1/2. A closer fit to the data can be obtained by allowing the slope to vary, shown as the thin red line, but the improvement in fit is not statistically significant (F = 2.33, p = 0.11, n = 43, extra sum of squares F test [640]) (Data read from Figure 8 of [159])
Fig. 9
Fig. 9
The influence of ABC transporters on the movements of lipophilic substances. The substance is presumed to be able to enter and leave the endothelial cells by diffusion with rate constant kdiff., which for simplicity in this example is assumed to be same on both sides. The substance is expelled from the cell by ABC transporters on the luminal side at a rate, kactiveccell. With these assumptions the effect of the ABC transporters on influx can be calculated by setting cisf = 0 and the effect on efflux by setting cplasma = 0. In both sets of equations, the first line states that at steady-state the net flux into the cell on one side must equal the net flux out of the cell on the other. From the next to the last lines of both sets of equations, if the rate of ABC mediated expulsion from the cell is small or zero, the rate constants for both influx and efflux are (kdiff./2). By contrast from the last lines if the rate of ABC mediated expulsion is large, influx to the brain, J, becomes very small, while efflux from the brain, J, is doubled compared to the efflux with no ABC transporter
Fig. 10
Fig. 10
Transport of organic anions across the blood–brain barrier. Organic anion transporters at the blood–brain barrier. The principal known transporters in the rat are shown. In human OAT3 is abluminal, while both OATP1A4 and OATP2B1 are present on both membranes. The ABC efflux pumps, P-gp, BCRP, MRP4 and MRP5, are all localized to the luminal, plasma facing, membrane. The Oat and Oatp transporters are exchangers (see Footnote 12). Localizations from [180] and the references in Table 1
Fig. 11
Fig. 11
GLUT and MCT transporters at or near the blood–brain barrier. GLUT1 and MCT1 are present on endothelial cells; GLUT1 and MCT4 on astrocytes (Figure simplified and redrawn from Simpson et al. [315])
Fig. 12
Fig. 12
Structure of the human glucose transporter GLUT1. The structure of full-length human GLUT1 containing two point mutations (N45T, E329Q) was determined in an inward-open conformation. The side and cytoplasmic views are shown. The corresponding transmembrane segments in the four 3-helix repeats are coloured the same. The extracellular and intracellular helices are coloured blue and orange, respectively. A slab of cut- open view of the surface electrostatic potential, which was calculated with PyMol50, is shown on the right to facilitate visualization of the inward-facing cavity. IC indicates intracellular helix. Reprinted by permission from Springer Nature from Nature 510, 121–126, Crystal structure of the human glucose transporter GLUT1 by Deng et al. [321]
Fig. 13
Fig. 13
Interpretation of net flux of a single solute, obligatory exchange, and trans-stimulation in terms of a simple carrier model. In each case the concentration of the first solute (filled black circle) is higher on the cis side (left) than on the trans side (right). a Net flux of solute from cis to trans is supported by return of the free carrier. b If return of the carrier is only possible with a solute bound, there is obligatory exchange, either self-exchange or counter-transport of another solute (circle). c Trans-stimulation is a combination of these two effects. Flux of the first solute from cis to trans can be increased if there is more solute (either sort) on the trans side (here the right) provided that increases the rate of return of the carrier—i.e. it increases the rate of conformation changes of the carrier from trans-facing to cis-facing
Fig. 14
Fig. 14
Four studies of brain glucose content versus glucose concentration in blood. In two studies glucose content was measured by chemical assay, a in anaesthetized rats by Buschiazzo et al. [319] and b in isolated perfused brains from dogs by Betz et al. [327]. In the latter it was assumed that brain water was 0.75 mL g−1. In the other two studies glucose content was determined by magnetic resonance spectroscopy, c in conscious humans by Gruetter et al. [337] and d in lightly anaesthetized rats by Choi et al. [338]. In all studies the glucose content continues to increase with plasma concentration even though it is known that the influx of glucose shows saturation. The explanation is that efflux also saturates and the increase in content must parallel the increase in plasma concentration in order for efflux to increase so that it is equal to influx minus the constant rate of glucose metabolism (see Appendix D)
Fig. 15
Fig. 15
Lactate removal from the brain. Lactate produced within the brain can be effluxed via the blood–brain barrier or via perivascular routes. It may reach the latter locally near the site of its production or at more distant sites having been transferred between astrocytes via gap junctions (Diagram modified from Figure 7c in Gandhi et al. [358])
Fig. 16
Fig. 16
Simplified overview of fates of amino acids in the brain parenchyma. Essential amino acids enter and leave the parenchyma across the blood–brain barrier. Non-essential amino-acids, e.g. glutamate (Glu), glutamine (Gln), and GABA can be synthesized within the brain. The amino groups for the synthesis are supplied either by transamination as shown for glutamate or to some extent [359] by incorporation of NH4+ by glutamate dehydrogenase. The latter route is believed to be minor [359, 641]. NH4+ is added to form the amide group of glutamine by glutamine synthetase (see Fig. 17). Within the parenchyma amino acids are used for synthesis of proteins and (not shown) formation of other nitrogen containing compounds, e.g. nucleotides. New amino acids must be supplied to replace those lost by metabolism. In the brain, input of amino acids is also required to provide amino groups to replace glutamate lost from the pool of amino acids involved in glutaminergic (and GABAergic, not shown) neurotransmission (see Fig. 17). α-KG α-ketoglutarate, e.a.a essential amino acids, t.a transaminase
Fig. 17
Fig. 17
The glutamate/glutamine cycle shown in bold with indication of some of the losses and of replenishment of glutamate by denovo synthesis. Glutamate (Glu) in the presynaptic neuron is packaged into vesicles and released into the ISF during neurotransmission. Most of the glutamate is taken up into the astrocytes by the transporter Eaat1 (glast, Slc1a3) where it is converted to glutamine (Gln) by addition of an NH4+ by the enzyme glutamine synthase (g.s) [642, 643]. The glutamine is transported into the ISF by Snat3 and/or Snat5 (Slc38a3 and Slc38a5) from which it is taken up into the presynaptic terminals again by a transporter that may be a Snat. The glutamate is then regenerated by glutaminase (g.a). This cycle represents a large turnover of the amide group at the end of the side chain in glutamine, estimated to be 55% of the CMRglc (cerebral metabolic rate of glucose, see Sect. 5.3) for the entire brain in rats amounting to 490 nmol g−1 min−1 (estimated value in humans 280 nmol g−1 min−1) [644] (G. A. Dienel, personal communication). However the requirement for NH4+ consumed in the conversion of glutamate to glutamine within the astrocytes is balanced by an equal release of NH4+ in the reverse conversion in neurons. Whether diffusion of NH4+ itself is adequate to transfer the nitrogen from neurons to astrocytes as shown or some other form of N carrier is required remains controversial [385, 641, 645]. Regardless, if there were no losses of glutamine or glutamate from the cycle, there would be no need for any fluxes of amino acids into or out of the parenchyma to support glutaminergic neurotransmission. However, there are losses of glutamate and glutamine from the cycle [347, 646, 647]. At least in rodents, such losses are made good by de novo synthesis of glutamate in the astrocytes. Estimates of the total rate of loss and of de novo synthesis are around 11% of CMRglc ([648, 649] (G. A. Dienel, personal communication), i.e. about 0.11 × 0.9 µmol g−1 min−1 ≅ 100 nmol g−1 min−1. The carbon skeletons for the de novo synthesis are derived ultimately from glucose. Glucose is metabolized to two molecules of pyruvate one of which is carboxylated by pyruvate carboxylase (p.c) (thought to be present within the brain only in astrocytes) to form oxaloacetic acid (OAA) a component of the citric acid cycle. Addition of acetyl-CoA from the second pyruvate then forms citrate, which is decarboxylated to form α-ketoglutarate (α-KG). Glutamate is then formed either a by transamination (t.a) of α-ketoglutarate using leucine or other amino acids as source (see e.g. [383, 641, 645, 650], or b by addition of NH4+ [366] catalyzed by glutamate dehydrogenase (g.d). The latter is believed to be a minor pathway [359, 366, 641]. The source of the amino groups for transamination is considered further in Sect. 5.5.3 and Fig. 18. Data for the pathways involved in glutamate synthesis are much less extensive for human than for rat. Rothman and colleagues [651, 652] have argued that the α-ketoglutarate is synthesized in astrocytes based on measurements of incorporation of 13C (see [653, 654]). However, the failure to find a key transaminase in human astrocytes by immunohistochemistry [655, 656] has cast some doubt on astrocytes being the major site for the conversion from α-ketoglutarate to glutamate. For recent reviews of glutamate synthesis see [386, 641, 645]
Fig. 18
Fig. 18
The branched chain amino acid shuttle for provision of branched chain amino acids (BCAA) in the astrocytes to allow de novo synthesis of glutamate. Leucine (Leu) is used as example of a BCAA. α-KG α-ketoglutarate, α-KIC α-ketoisocaproic acid, Gln glutamine, Glu glutamate, g.a glutaminase, g.d glutamate dehydrogenase, g.s glutamine synthetase, t.a transaminase. Losses of Gln, primarily by efflux, and of Glc, primarily by catabolism are replaced by de novo synthesis of α-KG in astrocytes and transamination using Leu producing α-KIC. Leu is regenerated from α-KIC in the neuron by transamination from Glu producing α-KG. The Glu is in turn regenerated from the α-KG and NH4+ by gdh. Loss of N via efflux of Gln, Glu, and Leu is made good by net inward flux of Leu and NH4+. The BCAA shuttle greatly reduces the need for net inward flux of Leu as this is only required to make good the metabolic loss of α-KIC (Based on Figure 1 in Hutson [384])
Fig. 19
Fig. 19
Amino acid transporters thought to exist at the blood–brain barrier. Based on Nalecz [200]; Broer [393]; Mann et al. [520]; O’Kane et al. [657]; and Hawkins et al. [44]. #See [44, 398] but contrast [399, 400]
Fig. 20
Fig. 20
Simplified outline of Aβ transport across the blood–brain barrier. Possible movements of Aβ are shown by solid or dashed lines with arrowheads indicating the principal direction. Endocytotic and exocytotic vesicles are shown as invaginations of the membranes. There is intracellular processing once the vesicles have been endocytosed. Aβ from ISF can bind directly to LRP1 on the abluminal membrane with the complex then being incorporated into a clathrin coated pit which can be endocytosed. The Aβ-LRP1 complex is stabilized by binding of the phosphatidylinositol-binding clathrin assembly protein (PICALM). Aβ in ISF can also be complexed with any of the forms of apoE, 2, 3 or 4 or with clusterin. Aβ-apoE2 and Aβ-apoE3 are substrates for interaction with LRP1 and endocytosis. By contrast Aβ-apoE4 inhibits LRP1 mediated endocytosis (dotted line), but can be endocytosed slowly after binding with the very low density lipoprotein receptor (VLDLR). Aβ-clusterin is a substrate for LRP2 mediated endocytois with transport across the blood–brain barrier to plasma. As Aβ-clusterin can also be transported in the opposite direction by LRP2-mediated endocytosis this is almost certainly by transcytosis of vesicles with LRP2 in the membrane. Vesicles with LRP1 in the membrane are also thought to discharge their contents on the far side of the barrier—i.e. this is transcytosis [465]. Some of the intracellular processing steps for the LRP1 vesicles are now known [452, 658]. Aβ is also transported from plasma to ISF. Aβ clusterin can be transported by LRP2 vesicles, but on the plasma side almost all of the LRP2 receptors are occupied by clusterin (dotted double headed arrow) rather than Aβ-clusterin which greatly reduces blood-to-brain transport by this route. Aβ is however, endocytosed after binding to the receptor for advanced glycation products, RAGE, and somehow transported to the brain side. Pgp may, in a manner which has not been well defined, assist transfer of Aβ from the endothelial cells to plasma whether it has entered the cells from ISF, via the LRP1 system, or from plasma, via the RAGE system. Figure based on [452, 464, 465]
Fig. 21
Fig. 21
Putative routes for periarterial efflux. In the intramural proposal solutes move parallel to the vessel wall along the basement membranes of the smooth muscle layer, shown as blue trajectories. In the extramural proposal movements of solutes parallel to the vessel occur primarily in a perivascular space with lower resistance to flow. They also move in and out of the wall by a combination of diffusion and convection, shown as the red trajectories. As discussed in Sect. 3.1 the nature of the extramural pathway is still controversial including whether it is a space one side or the other of the pial cells or alternatively the pial and glial basement membranes themselves. endo endothelium, s.m smooth muscle, BM basement membrane. Pial cells and pial basement membrane(s) are shown together because they are very thin
Fig. 22
Fig. 22
The relation between the rate of elimination of a substance and its concentration. The solid curve in a and line in b show the rate of elimination as a proportion of its possible maximum versus concentration. Possible rates of input are shown as the dashed lines. In a if the rate of input is Rin,1 which is less than the maximum possible rate of elimination, Relim,max, the concentration can be maintained at css. If the rate of input is Rin,2, which exceeds Relim,max, no steady-state is possible and the concentration continually increases. At low concentrations as shown in detail in b the rate of elimination is usually proportional to concentration
Fig. 23
Fig. 23
The relationship between the rates of input and elimination, substrate concentration in ISF and clearance. At steady-state the rate of elimination must equal the rate of input. The horizontal dashed lines show rates of input (R1, R2, R3 and Rin). The clearance, CL, is the slope of the line for the plot of rate of elimination versus concentration. Lines for three values of clearance (CL1, CL2 and CL3) are shown. a To achieve the steady-state concentration, cisf, clearance must be higher to balance the higher rate of input i.e. the rate of input required is proportional to clearance. b For a given rate of input, the steady-state concentration is inversely proportional to CL (compare the three steady state concentrations c1 c2 and c3 achievable for the three clearance values CL1, CL2 and CL3). c For a given clearance the steady-state concentration is proportional to the rate of input. Changes in input need not produce changes in concentration if the clearance can be changed, e.g. for the increase from R1 to R3 shown in a the concentration would be constant if the clearance could be increased from CL1 to CL3
Fig. 24
Fig. 24
Diagram illustrating possible schemes for neurovascular coupling, i.e. regulation of blood flow changes associated with nerve activity. Two forms of control are shown, a simple feedback based on the signal to be regulated, e.g. pCO2, and b feedback plus feed-forward. The feed-forward element, signal2, in b, possibly from astrocytes, allows blood flow to increase with smaller changes in the primary quantity to be regulated, signal1 (Figure reproduced from [4])
Fig. 25
Fig. 25
Comparison of the predictions of the solubility-diffusion theory and of the linear free energy relation (LFER) for the PS product of the series of 18 compounds considered by Gratton et al. [166]. The solubility-diffusion theory, described in Sect. 4.1, predicts that log[PS] is proportional to Koctanol/water MW−1/2. MW is in turn approximately proportional to the McGowan characteristic volume used by Gratton et al. The straight, grey line with slope 1 indicates the predicted proportionality. It has one adjustable parameter that determines the vertical position of the line. The LFER prediction, described in this Appendix and shown as the line with multiple segments, has four adjustable parameters, three coefficients of descriptors of the compounds and the constant determining the vertical position of the whole curve. The improvement in fit is statistically significant (extra sum of squares test [640], F = 8.85 for 17 and 14 degrees of freedom, p < 0.001)

References

    1. Coles JA, Myburgh E, Brewer JM, McMenamin PG. Where are we? The anatomy of the murine cortical meninges revisited for intravital imaging, immunology, and clearance of waste from the brain. Prog Neurobiol. 2017;156:107–148. doi: 10.1016/j.pneurobio.2017.05.002. - DOI - PubMed
    1. Damkier HH, Brown PD, Praetorius J. Cerebrospinal fluid secretion by the choroid plexus. Physiol Rev. 2013;93:1847–1892. doi: 10.1152/physrev.00004.2013. - DOI - PubMed
    1. Spector R, Keep RF, Snodgrass SR, Smith QR, Johanson CE. A balanced view of choroid plexus structure and function: focus on adult humans. Exp Neurol. 2015;267:78–86. doi: 10.1016/j.expneurol.2015.02.032. - DOI - PubMed
    1. Hladky SB, Barrand MA. Fluid and ion transfer across the blood–brain and blood–cerebrospinal fluid barriers; a comparative account of mechanisms and roles. Fluids Barriers CNS. 2016;13:19. doi: 10.1186/s12987-016-0040-3. - DOI - PMC - PubMed
    1. Chen L, Beckett A, Verma A, Feinberg DA. Dynamics of respiratory and cardiac CSF motion revealed with real-time simultaneous multi-slice EPI velocity phase contrast imaging. Neuroimage. 2015;122:281–287. doi: 10.1016/j.neuroimage.2015.07.073. - DOI - PMC - PubMed

Substances

LinkOut - more resources