

High-affinity interactions and signal transduction between Aβ oligomers and TREM2
- PMID: 30341064
- PMCID: PMC6220267
- DOI: 10.15252/emmm.201809027
High-affinity interactions and signal transduction between Aβ oligomers and TREM2
Abstract
Rare coding variants in the triggering receptor expressed on myeloid cells 2 (TREM2) are associated with increased risk for Alzheimer's disease (AD), but how they confer this risk remains uncertain. We assessed binding of TREM2, AD-associated TREM2 variants to various forms of Aβ and APOE in multiple assays. TREM2 interacts directly with various forms of Aβ, with highest affinity interactions observed between TREM2 and soluble Aβ42 oligomers. High-affinity binding of TREM2 to Aβ oligomers is characterized by very slow dissociation. Pre-incubation with Aβ is shown to block the interaction of APOE In cellular assays, AD-associated variants of TREM2 reduced the amount of Aβ42 internalized, and in NFAT assay, the R47H and R62H variants decreased NFAT signaling activity in response to Aβ42. These studies demonstrate i) a high-affinity interaction between TREM2 and Aβ oligomers that can block interaction with another TREM2 ligand and ii) that AD-associated TREM2 variants bind Aβ with equivalent affinity but show loss of function in terms of signaling and Aβ internalization.
Keywords: APOE; Alzheimer's disease; TREM2; amyloid; innate immune response.
© 2018 The Authors. Published under the terms of the CC BY 4.0 license.
Figures

- A
Media from soluble TREM2‐Fc transfected HEK293T cells incubated with Aβ42 fibrils. Top left panel shows original media samples. Top right panel shows the presence of soluble TREM2 associated with Aβ42 pellet. The bottom two panels represent the same samples as the top, but probed with 6E10.
- B
RIPA lysate from TREM2 transfected HEK293T cells incubated with Aβ42 fibrils. Top left panel shows original RIPA lysate samples, and top right panel shows the presence of TREM2 associated with Aβ42 pellet. The bottom two panels represent the same samples as the top, but probed with 6E10.
- C
Media from soluble TREM2‐Fc and APOE3 co‐transfected HEK293T cells incubated with agarose beads anti‐human IgG Fc. Left panels show original media samples. Right panels show the purified soluble TREM2‐Fc (bottom) and the presence of APOE3 with the purified soluble TREM2‐Fc (top).
- D
Media from soluble TREM‐Fc family member transfected HEK293T cells incubated with Aβ42 fibrils. Top panel shows original media sample and the presence of TREM family members associated with Aβ42 pellet. Bottom panel shows original media and Aβ42 pellet probed with 6E10.
- E
Media from soluble TREM‐Fc family members and APOE3 co‐transfected HEK293T cells incubated with agarose beads anti‐human IgG Fc. Top panel shows original media sample and the presence of soluble TREM family members associated with APOE3. Bottom panel shows original media and purified soluble TREM‐Fc family members probed with anti‐V5.

- A
Original Western blot from Fig 1A.
- B
Original Western blot from Fig 1B.
- C
Original Western blot from Fig 1C.

- A
Schematic representation an Aβ antibody association on soluble TREM2‐Fc pre‐incubated with Aβ42 oligomers.
- B
Western blot analysis of purified soluble TREM‐Fc and soluble trem2‐Fc family members and Aβ oligomers.

- A
Schematic representation of a full‐length experiment.
- B
Schematic representation of Aβ42 oligomers (right panel) and APOE4 (left panel) binding with soluble TREM2‐Fc at various concentrations. Curves were fit by setting buffer control (no ligand) to y = 0.
- C
Calculated Kon, Kdis, and KD values for Aβ42 oligomers or Aβ42 monomers, Aβ40 monomers, or APOE3 or APOE4 association/dissociation with soluble TREM2‐Fc and AD variants. Kinetic constants were calculated using five different concentrations of ligand, and the entire experiment (including new ligand preparations and purifications of soluble TREM‐Fc) was repeated twice (# P < 0.05, ANOVA, Tukey's multiple comparison test, see Appendix Table S1 for exact P‐value).
- D
Calculated Kon, Kdis, and KD value for Aβ42 oligomers association/dissociation with soluble human vs. mouse TREM‐Fc family members. Kinetic constants were calculated using five different concentrations of ligand, and the entire experiment (including new ligand preparations and purifications of soluble TREM‐Fc) was repeated twice.

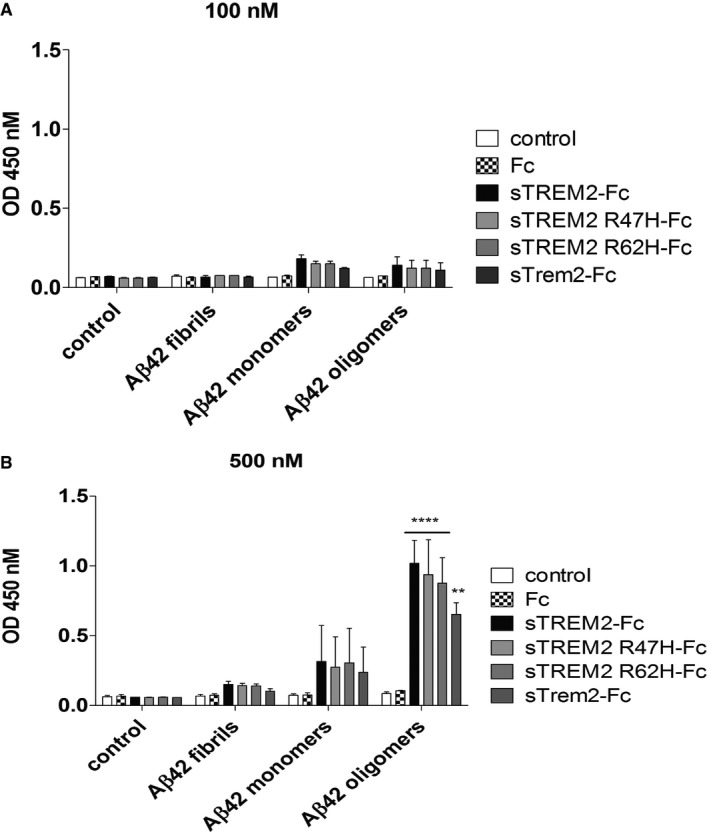
- A, B
ELISA plates coated with soluble TREM2‐Fc and AD variants were incubated with various concentrations of Aβ42 aggregates or monomers or oligomers: (A) 100 nM and (B) 500 nM. Results were expressed as the OD450 averaged ± standard error (n = 2, **P < 0.01, ****P < 0.0001, two‐way ANOVA, Bonferroni multiple comparisons, compared to Fc, see Appendix Table S4 for exact P‐values).

- A
Binding of Aβ42 monomers with soluble TREM2‐Fc shows a dose‐dependent signal. Results were expressed as the OD450 averaged ± standard error (n = 3; *P < 0.05, **P < 0.01, ***P < 0.001, ****P < 0.0001, two‐way ANOVA, Bonferroni multiple comparisons, see Appendix Table S2 for exact P‐values).
- B
Binding of 1 μM Aβ42 oligomers with soluble TREM‐Fc family members. Results were expressed as the OD450 averaged ± standard error (n = 4, *P < 0.05, ****P < 0.0001, ANOVA, Bonferroni multiple comparisons, see Appendix Table S2 for exact P‐values).

- A
2B4 NFAT‐GFP reporter cells transduced with TREM2 or AD variant R47H were incubated with various concentrations of Aβ42 oligomers for 12 h. GFP expression was detected at 1 μM Aβ42 oligomers with TREM2 transduced cells. No GFP expression was detected with Aβ42 oligomers from control transduced cells. Results were expressed as the percentage GFP cells averaged ± standard error (n = 3, *P < 0.05 compared with mock, ****P < 0.0001 compared with mock, # P < 0.05 compared with TREM2, #### P < 0.0001 compared with TREM2, two‐way ANOVA, Bonferroni multiple comparisons, see Appendix Table S3 for exact P‐values).
- B
B‐2B4 NFAT‐GFP reporter cells transduced with TREM2 or variants (R47H, R62H, and T96K) were incubated with 10 μM Aβ42 oligomers for 12 h. No GFP expression was detected with Aβ42 oligomers from control transduced cells. Results were expressed as the percentage GFP cells averaged ± standard error (n = 3, *P < 0.05 compared with TREM2, **P < 0.05 compared with TREM2, ****P < 0.0001 compared with TREM2, ## P < 0.01 compared with TREM2 T96K, ### P < 0.001 compared with TREM2 T96K, #### P < 0.0001 compared with TREM2 T96K, ANOVA, Dunnett's multiple comparisons test, see Appendix Table S3 for exact P‐values.
- C
HEK293T cells transfected with TREM2 or AD variant incubated with 500 nM Aβ42 monomers were lysed for Aβ42 quantifications by ELISA. Expression of TREM2 increases Aβ42 level detected compared to mock control as well the AD variant. Results were averaged ± standard error (n = 9, # P < 0.05 compared with TREM2, ## P < 0.01 compared with TREM2, ***P < 0.001 compared with mock, ****P < 0.0001 compared with mock, ANOVA, Tukey's multiple comparison test, see Appendix Table S3 for exact P‐values).
- D
HEK293T cells transfected with TREM2 were incubated with Aβ42 oligomers for 16 h. Conditioned media and cell lysate were analyzed by Western blot for TREM2 (RIPA lysate) and soluble TREM2 (media) detection. Experiment was replicated 3 independent times.
- E
HEK293T cells transfected with TREM2 were subjected to cell membrane biotinylation for purification. Bottom panel in (D) shows the presence of TREM2 in the purified product. Endogenous APP and β‐tubulin were used as controls for the purification (middle and upper panels). Experiment was replicated 3 independent times.
References
-
- Bianchin MM, Lima JE, Natel J, Sakamoto AC (2006) The genetic causes of basal ganglia calcification, dementia, and bone cysts: DAP12 and TREM2. Neurology 66: 615–616; author reply 615‐616 - PubMed
-
- Carrasquillo MM, Allen M, Burgess JD, Wang X, Strickland SL, Aryal S, Siuda J, Kachadoorian ML, Medway C, Younkin CS et al (2017) A candidate regulatory variant at the TREM gene cluster associates with decreased Alzheimer's disease risk and increased TREML1 and TREM2 brain gene expression. Alzheimers Dement 13: 663–673 - PMC - PubMed
Publication types
MeSH terms
Substances
Grants and funding
LinkOut - more resources
Full Text Sources
Molecular Biology Databases
Miscellaneous
