. 2018 Oct 19;9(1):4349.
doi: 10.1038/s41467-018-06648-6.

Incompatibility of the circadian protein BMAL1 and HNF4α in hepatocellular carcinoma

Affiliations

Incompatibility of the circadian protein BMAL1 and HNF4α in hepatocellular carcinoma

Baharan Fekry et al. Nat Commun. .

Abstract

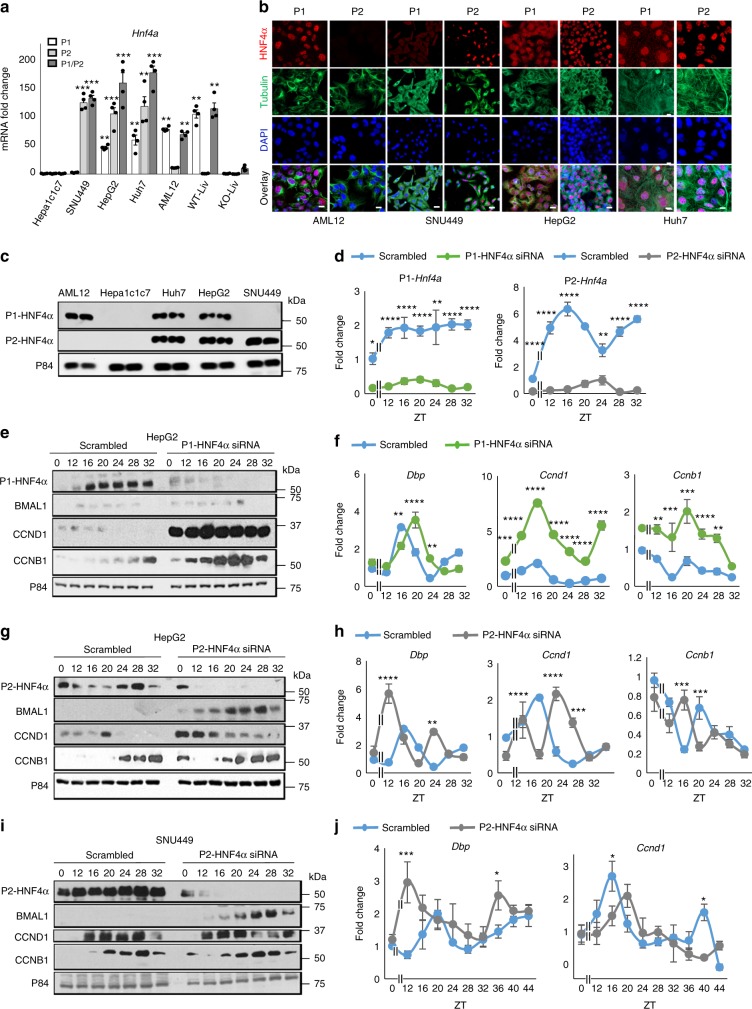
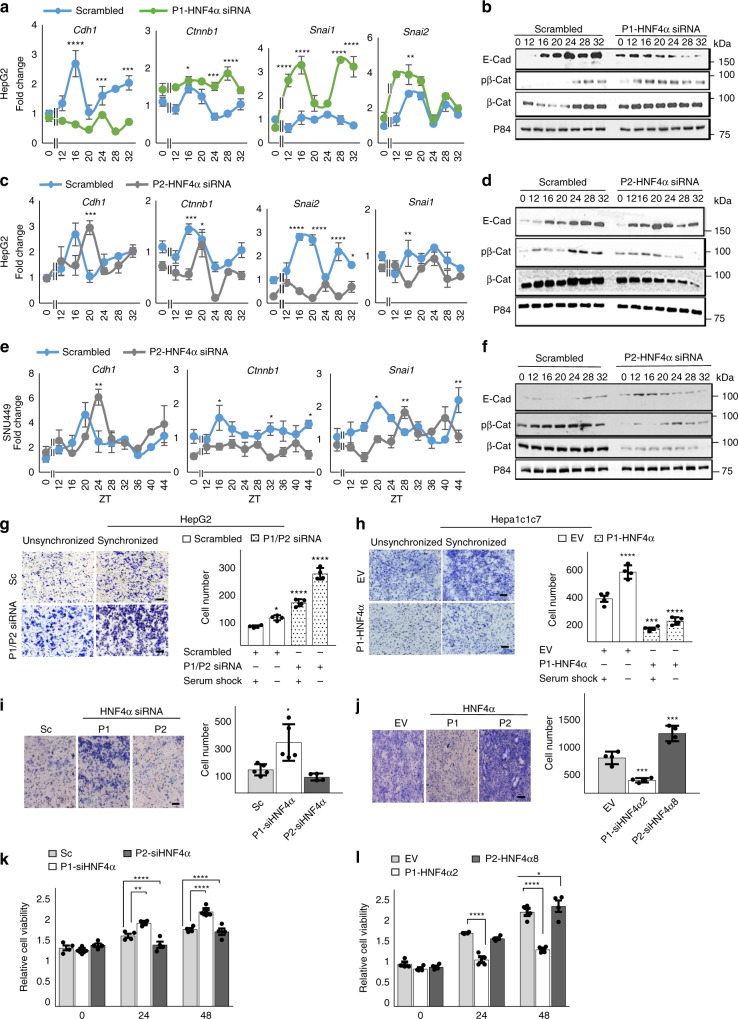
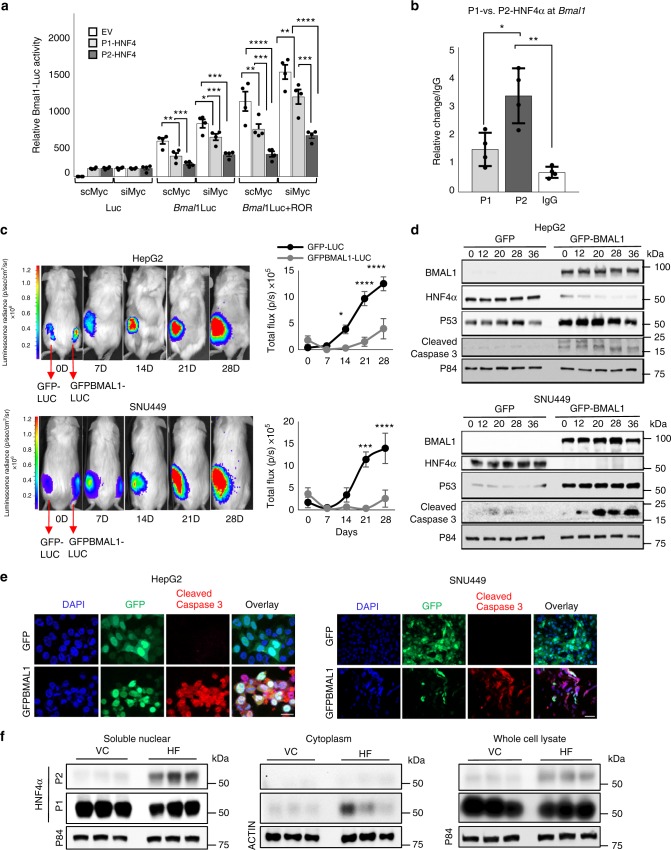
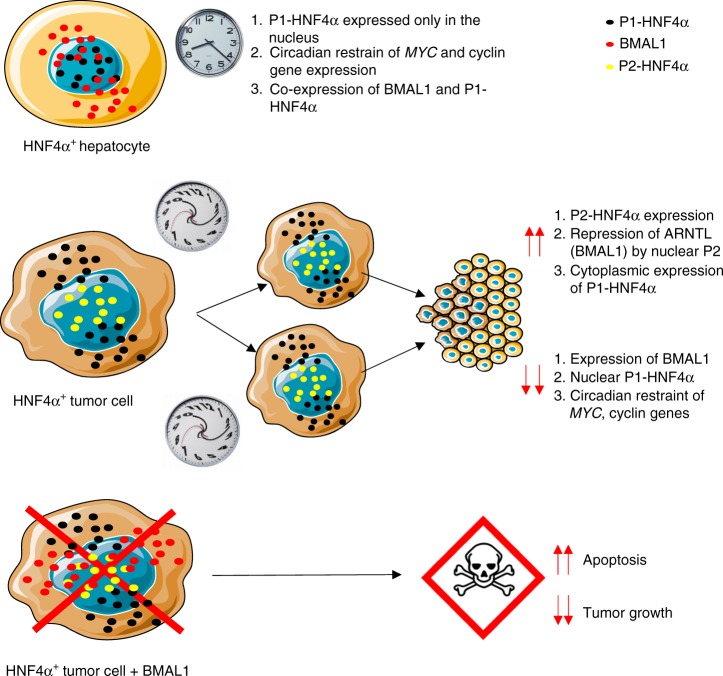
Hepatocyte nuclear factor 4 alpha (HNF4α) is a master regulator of liver-specific gene expression with potent tumor suppressor activity, yet many liver tumors express HNF4α. This study reveals that P1-HNF4α, the predominant isoform expressed in the adult liver, inhibits expression of tumor promoting genes in a circadian manner. In contrast, an additional isoform of HNF4α, driven by an alternative promoter (P2-HNF4α), is induced in HNF4α-positive human hepatocellular carcinoma (HCC). P2-HNF4α represses the circadian clock gene ARNTL (BMAL1), which is robustly expressed in healthy hepatocytes, and causes nuclear to cytoplasmic re-localization of P1-HNF4α. We reveal mechanisms underlying the incompatibility of BMAL1 and P2-HNF4α in HCC, and demonstrate that forced expression of BMAL1 in HNF4α-positive HCC prevents the growth of tumors in vivo. These data suggest that manipulation of the circadian clock in HNF4α-positive HCC could be a tractable strategy to inhibit tumor growth and progression in the liver.


Conflict of interest statement

The authors have the following interests to report: F.M.S. is currently or has previously consulted for Ambys, Cell Design Labs (now part of Gilead Science). The remaining authors declare no competing interests.

Figures

Fig. 1
Fig. 1
HNF4α is heterogeneously expressed in HCC. a Immunofluorescence (IF) reveals P1/P2-HNF4α expression and subcellular localization in mouse and human HCC, hepatoblastoma cancer lines, and in the nontransformed liver cell line, AML12, grown in monolayer conditions. b RT-PCR reveals mRNA abundance of P1/P2-HNF4α in HCC cell lines in vitro, fold change over AML12 Hnf4a mRNA. Compared to ZT0 at the same time, *P < 0.01, **P < 0.01, ***P < 0.001, ****P < 0.0001, one-way ANOVA test, Dunnett’s multiple comparisons test. (N = 4). c Western blot showing P1/P2-HNF4α abundance in whole cell lysates of cancer cell lines and nontransformed AML12 cells. d Staining of 3D, HCC- and hepatoblastoma-derived spheroids from HepG2 and Hepa-1c1c7 cells with antibodies against P1/P2-HNF4α. e IF staining of spontaneous HCC isolated from jet-lagged WT mice using antibody to P1/P2-HNF4α. f mRNA expression of HNF4a in human HCC tumors and surrounding normal liver tissue (R2: genomics analysis and visualization platform). g IF staining of human normal (“Ctrl”), cirrhotic, hyperplastic, and HCC tumor tissue using antibody against P1/P2-HNF4α (G = grades, advancement increasing with number). h RT-PCR reveals the circadian expression of P1/P2-Hnf4a, Dbp, Ccnd1, Ccnb1 and Myc following the application of scrambled (Sc) or siRNA specific to P1/P2-Hnf4a in AML12 cells (top panel) or in the liver of WT and HNF4α knockout (KO) mice (bottom panel). Compared to controls at the same time, *P < 0.03, **P < 0.005, ***P < 0.001, ****P < 0.0001, two-way ANOVA test, Sidak’s multiple comparisons test. (N = 8–43). Scale bar is 50 µm. (See Supplementary Table 1 for JTK_Cycle Rhythmicity Statistics.) Error bars = SEM
Fig. 2
Fig. 2
Inverse expression of HNF4α and BMAL1 in HCC. a RT-PCR reveals ARNTL (BMAL1) mRNA abundance in HCC and hepatoblastoma lines expressing varying levels of P1/P2-Hnf4a mRNA as well as the nontransformed hepatocyte cell line, AML12. Levels of BMAL1 mRNA expression compared to AML12 cells, **P < 0.001, ****P < 0.0001, one-way ANOVA test, Dunnett’s multiple comparisons test. (N = 4). b Western blot reveals BMAL1, P1/P2-HNF4α, and CCND1 protein levels in HNF4α-positive and HNF4α-negative liver cancer lines as well as in nontransformed AML12 cells. c Staining of 2D HCC cells and AML12 cells with antibodies to BMAL1 and to P1/P2-HNF4α. Overlap with DAPI nuclear stain. d Human HCC microarray datasets reveal inverse gene expression of HNF4a and ARNTL (BMAL1) mRNA in HCC specimens (P < 0.0017) (N = 134). e Staining of 3D spheroids generated from HepG2 and Hepa-1c1c7 cells with antibody to P1/P2-HNF4α and BMAL1. Overlay with DAPI nuclear signal. f Staining of spontaneous mouse HCC from jet-lagged mice using antibodies to BMAL1 and P1/P2-HNF4α. Overlay with DAPI nuclear stain. g Human HCC specimens stained with antibodies for BMAL1 and P1/P2-HNF4α. Overlay with DAPI nuclear stain (G = tumor grade, increasing with number). Scale bar is 50 µm. Error bars = SEM
Fig. 3
Fig. 3
The P2 isoform of HNF4α is uniquely expressed in HCC and has distinct circadian activity. a RT-PCR reveals the mRNA abundance of P1-HNF4a and P2-HNF4a in hepatoblastoma and HCC lines, nontransformed AML12 cells, and wild-type (WT) and Hnf4a knockout (KO) liver tissues using primers to each isoform. b Staining of AML12, hepatoblastoma, and HCC cell lines with antibodies specific to P1-HNF4α or P2-HNF4α. Overlay with DAPI nuclear stain. c Western blot of lysates from AML12, hepatoblastoma, and HCC cell lines with antibodies specific to P1-HNF4α, P2-HNF4α, or P84 proteins. d RT-PCR reveals expression of P1-HNF4a or P2-HNF4a following serum synchronization in HepG2 cells and using siRNA specific to P1-HNF4a (left panel) or P2-HNF4a (right panel). e Western blot analysis showing P1-HNF4α, BMAL1, CCND1, and CCNB1 protein expression in HepG2 cells serum shocked and previously treated with siRNA specific to P1-HNF4a or with scrambled oligonucleotides. f RT-PCR reveals the expression of DBP, CCND1, and CCNB1 following serum shock and knockdown of P1-HNF4a with specific siRNA or scrambled (Sc) oligonucleotides. g Western blot showing P2-HNF4α, BMAL1, CCND1, and CCNB1 protein expression following expression of scrambled or P2-HNF4α-specific siRNA oligonucleotides. h RT-PCR reveals the circadian expression of DBP, CCND1, and CCNB1 following knockdown of P2-HNF4α. i Western blot showing P2-HNF4α, BMAL1, CCND1, and CCNB1 expression in SNU449 cells after serum shock and previously treated with scrambled oligonucleotides or siRNA oligonucleotides specific to P2-HNF4α. j RT-PCR reveals the expression of DBP and CCND1 following the application of scrambled (Sc) or siRNA specific to the P2-HNF4a isoform in SNU449 cells. Two-way ANOVA, Sidak’s multiple comparisons test, *P < 0.03, **P < 0.005, ***P < 0.0005, ****P < 0.0001. (N = 4). Scale bar 50 µm. (See Supplementary Table 1 for JTK_Cycle Rhythmicity Statistics.) Error bars = SEM
Fig. 4
Fig. 4
Circadian control of EMT by HNF4α is isoform specific. a RT-PCR reveals mRNA abundance of EMT genes CDH1, CTNNB1, SNAI1, and SNAI2 after serum shock with prior application of scrambled oligonucleotides or siRNA specific to P1-HNF4α in HepG2 cells. b Western blot showing expression of CDH1, phosphorylated, and total β-catenin (CTNNB1, β-Cat), after P1-HNF4α knockdown followed by serum shock. c RT-PCR reveals expression of EMT genes following serum shock and prior application of scrambled or siRNA specific to P2-HNF4a. d Western blot showing expression of CDH1, phosphorylated and total β-Cat following knockdown of P2-HNF4α and serum shock. e RT-PCR reveals circadian expression of EMT genes CDH1, CTNNB1, and SNAI1 after inhibition of P2-HNF4α using specific siRNA oligonucleotides in SNU449 cells. f Western blot showing the expression of CDH1 and phosphorylated and total β-Cat after P2-HNF4α knockdown following serum shock in SNU449 cells. Two-way ANOVA, Sidak’s multiple comparisons test, *P < 0.03, **P < 0.005, ***P < 0.0005, ****P < 0.0001, (N = 4). g Invasion assay reveals invaded unsynchronized or circadian synchronized HepG2 cells expressing scrambled or siRNA for P1/P2-HNF4a, 48 h after plating. Quantification, right panel. h Invaded unsynchronized or synchronized Hepa-1c1c7 cells following serum synchronization and prior overexpression of P1-HNF4α. Quantification, right panel. i Invaded synchronized HepG2 cells following application of scrambled (“Sc”), P1-HNF4a, or P2-HNF4a siRNA oligonucleotides. Quantification, right panel. j Invaded synchronized Hepa-1c1c7 cells following overexpression of P1-HNF4α or P2-HNF4α. Quantification, right panel. Compared to SC or EV at the same time: *P < 0.05, **P < 0.01, ***P < 0.001, ****P < 0.0001, one-way ANOVA test, Dunnett’s multiple comparisons test. (N = 5). k Fold change in proliferating HepG2 cells following P1-HNF4α vs. P2-HNF4α knockdown at 24- and 48 h using MTT assay. l MTT assay reveals proliferating Hepa-1c1c7 cells after transfection with empty vector (EV), P1-Hnf4a (Hnf4a2) or P2-Hnf4a (Hnf4a8) at 24- and 48 h using MTT assay. Comparing SC/EV to P1/P2-siHNF4α or between P1-siHNF4α and P2-siHNF4α: Two-way ANOVA, Sidak’s multiple comparisons test, *P < 0.03, **P < 0.005, ***P < 0.0005, ****P < 0.0001, (N = 6). Scale bar 100 µm. (See Supplementary Table 1 for JTK_Cycle Rhythmicity Statistics.) Error bars = SEM
Fig. 5
Fig. 5
Altered subcellular localization of HNF4α isoforms in HCC. a Western blot shows the expression of P1-HNF4α and P2-HNF4α in the soluble nuclear, cytoplasmic, and chromatin fractions of AML12, hepatoblastoma, and HCC lines. b Western blot showing the expression of BMAL1 in cellular compartments and whole cell lysates of mice expressing exclusively P1-HNF4α (WT) or P2-HNF4α (α7HMZ mice) (PonS = ponceau S). c Immunofluorescence of control tissue and metastasized human HCC specimens with antibodies specific to P1-HNF4α, P2-HNF4α, or to P1/P2-HNF4α. d Western blot showing P2-HNF4α and P1-HNF4α localization to the soluble nuclear compartment or the cytoplasm following overexpression of P2-HNF4α in AML12 cells. e FKPM counts from RNA-seq for Src, Myc, Fgfr1, Mmp14, and Cdh1 mRNAs in WT or αHMZ livers. f FKPM counts from RNA-seq for Ctnnbip1, Serpinf1, Axin1, and Porcn in WT or αHMZ livers. *P < 0.05, **P < 0.01, ***P < 0.001, ****P < 0.0001, (N = 3). Scale bar is 50 µm. Error bars = SEM
Fig. 6
Fig. 6
BMAL1 overexpression in HNF4α-positive HCC inhibits tumor growth a Luciferase assay results showing luciferase expression from BMAL1-LUC following transfection of DNA for the empty vector (EV), P1-Hnf4a or P2-Hnf4α with or without co-expression of RORα and with co-application of scrambled or Myc siRNA oligonucleotides. Comparing EV to P1/P2-HNF4α. Two-way ANOVA, Sidak’s multiple comparisons test, *P < 0.03, **P < 0.005, ***P < 0.0005, ****P < 0.0001, (N = 6). b Chromatin immunoprecipitation (ChIP) of P1- or P2-HNF4α in HepG2 cells followed by qPCR reveals amplification of BMAL1 sequence upstream of the transcriptional start. c In vivo bioluminescence of hepatoblastoma and HCC tumors in immune compromised mice on days 0, 7, 14, 21, and 28 after subcutaneous injection of HepG2 or SNU449 cells expressing vectors Luc and Gfp or Luc and Gfp-Bmal1. Quantification of tumor size, right panel. Two-way ANOVA, Sidak’s multiple comparisons test, *P < 0.03, **P < 0.005, ***P < 0.0005, ****P < 0.0001. (N = 6–9). Scale bar is 100 µm. d Western blot reveals the abundance of BMAL1, P1/P2-HNF4α, P53, cleaved caspase 3, and P84 after serum synchronization of HepG2 and SNU449 cells previously transfected with Gfp or Gfp-Bmal1. e Staining of HepG2 and SNU449 cells 48 h after infection with virus containing Gfp-Bmal1, using antibodies to GFP and cleaved caspase 3. Overlay with DAPI nuclear stain. Scale bar is 20 µm. f Western blot showing P2-HNF4α and P1-HNF4α localization in the soluble nuclear and cytoplasmic cellular compartments, or in whole cell lysates of livers from animals with diet-induced obesity, using antibodies specific to P2-HNF4α or P1-HNF4α. Error bars = SEM
Fig. 7
Fig. 7
Model of HNF4α isoform and BMAL1 expression in normal vs. cancer cells. In normal hepatocytes, the P1-HNF4α isoform and the circadian protein BMAL1 are concomitantly expressed. While BMAL1 is found in both nuclear and cytoplasmic compartments, P1-HNF4α is found exclusively in the nucleus, where it both activates and represses target genes, sometimes in a circadian manner. In HCC, P2-HNF4α is induced, resulting in either the dual expression of both P1-HNF4α and P2-HNF4α or only P2-HNF4α in HNF4α-positive tumors (approximately 50% of HCC). Induction of P2-HNF4α results in direct transcriptional repression of BMAL1 and a large portion of P1-HNF4α becomes cytoplasmic, reducing its ability to repress target cyclin and EMT genes in a circadian manner. Forced expression of BMAL1 in HNF4α-positive HCC results in a cell death and inhibition of tumor growth

Similar articles

Cited by

References

    1. Mazzanti R, Arena U, Tassi R. Hepatocellular carcinoma: where are we? World J. Exp. Med. 2016;6:21–36. doi: 10.5493/wjem.v6.i1.21. - DOI - PMC - PubMed
    1. Sun B, Karin M. Obesity, inflammation, and liver cancer. J. Hepatol. 2012;56:704–713. doi: 10.1016/j.jhep.2011.09.020. - DOI - PMC - PubMed
    1. Asher G, Sassone-Corsi P. Time for food: the intimate interplay between nutrition, metabolism, and the circadian clock. Cell. 2015;161(84):92. doi: 10.1016/j.cell.2015.03.015. - DOI - PubMed
    1. Bass J, Takahashi JS. Circadian integration of metabolism and energetics. Science. 2010;330:1349–1354. doi: 10.1126/science.1195027. - DOI - PMC - PubMed
    1. Partch CL, Green CB, Takahashi JS. Molecular architecture of the mammalian circadian clock. Trends Cell Biol. 2014;24:90–99. doi: 10.1016/j.tcb.2013.07.002. - DOI - PMC - PubMed

Publication types

MeSH terms