. 2018 Oct 19;9(1):4361.
doi: 10.1038/s41467-018-06805-x.

Large-scale genome-wide enrichment analyses identify new trait-associated genes and pathways across 31 human phenotypes

Affiliations

Large-scale genome-wide enrichment analyses identify new trait-associated genes and pathways across 31 human phenotypes

Xiang Zhu et al. Nat Commun. .

Abstract

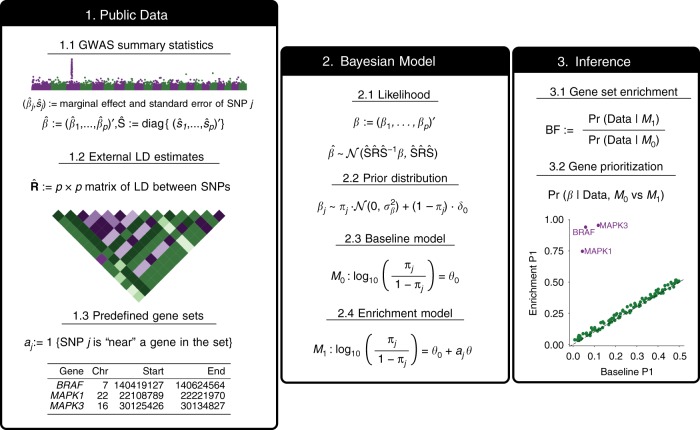
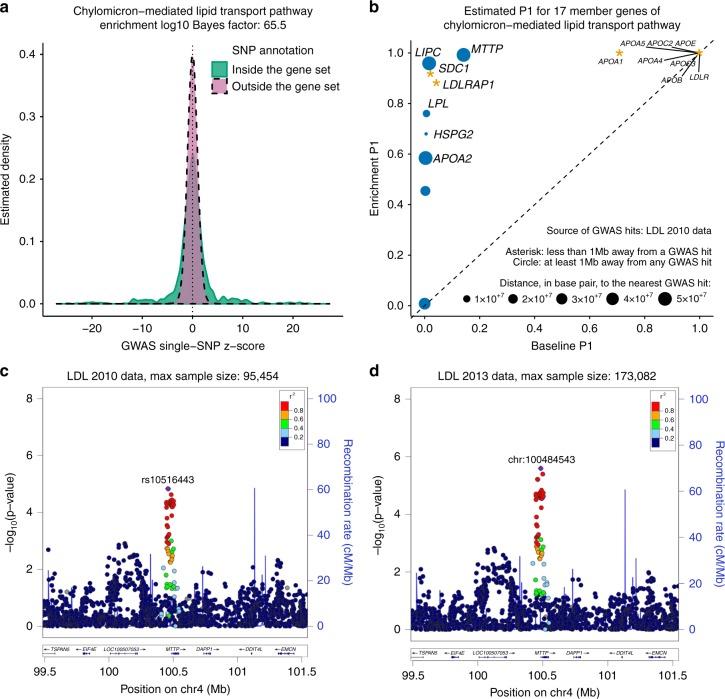
Genome-wide association studies (GWAS) aim to identify genetic factors associated with phenotypes. Standard analyses test variants for associations individually. However, variant-level associations are hard to identify and can be difficult to interpret biologically. Enrichment analyses help address both problems by targeting sets of biologically related variants. Here we introduce a new model-based enrichment method that requires only GWAS summary statistics. Applying this method to interrogate 4,026 gene sets in 31 human phenotypes identifies many previously-unreported enrichments, including enrichments of endochondral ossification pathway for height, NFAT-dependent transcription pathway for rheumatoid arthritis, brain-related genes for coronary artery disease, and liver-related genes for Alzheimer's disease. A key feature of our method is that inferred enrichments automatically help identify new trait-associated genes. For example, accounting for enrichment in lipid transport genes highlights association between MTTP and low-density lipoprotein levels, whereas conventional analyses of the same data found no significant variants near this gene.


Conflict of interest statement

The authors declare no competing interests.

Figures

Fig. 1
Fig. 1
Schematic overview of RSS-E, a model-based enrichment analysis method for GWAS summary statistics. RSS-E combines three types of public data: GWAS summary statistics (1.1), external LD estimates (1.2), and predefined SNP sets (1.3). GWAS summary statistics consist of a univariate effect size estimate (β^j) and corresponding standard error (ŝj) for each SNP, which are routinely generated in GWAS. External LD estimates are obtained from an external reference panel with ancestry matching the population of GWAS cohorts. SNP sets here are derive from gene sets based on biological pathways or sequencing data. We combine these three types of data by fitting a Bayesian multiple regression (2.1–2.2) under two models about the enrichment parameter (θ): the baseline model (2.3) that each SNP has equal chance of being associated with the trait (M0: θ = 0), and the enrichment model (2.4) that SNPs in the SNP set are more often associated with the trait (M1: θ > 0). To test enrichment, RSS-E computes a Bayes factor (BF) comparing these two models (3.1). RSS-E also automatically prioritizes loci within an enriched set by comparing the posterior distributions of genetic effects (β) under M0 and M1 (3.2). Here we summarize the posterior of β as P1, the posterior probability that at least one SNP in a locus is trait-associated. Differences between P1 estimated under M0 and M1 reflect the influence of enrichment on genetic associations, which can help identify new trait-associated genes (3.2)
Fig. 2
Fig. 2
Comparison of RSS-E to other methods for identifying enrichments from GWAS summary statistics. We used real genotypes to simulate individual-level data under two genetic architectures (“sparse” and “polygenic”) with four baseline-enrichment patterns: a baseline and enrichment datasets followed baseline (M0) and enrichment (M1) models in RSS-E; b baseline datasets assumed that a random set of near-gene SNPs were enriched for genetic associations and enrichment datasets followed M1; c baseline datasets assumed that a random set of coding SNPs were enriched for genetic associations and enrichment datasets followed M1; d baseline datasets followed M0 and enrichment datasets assumed that trait-associated SNPs were both more frequent, and had larger effects, inside than outside the target gene set. We computed the corresponding single-SNP summary statistics, and, on these summary data, we compared RSS-E with Pascal and LDSC using their default setups. Pascal includes two gene scoring options: maximum-of-χ2 (-max) and sum-of-χ2 (-sum), and two pathway scoring options: χ2 approximation (-chi) and empirical sampling (-emp). For each simulated dataset, both Pascal and LDSC produced enrichment p values, whereas RSS-E produced an enrichment BF; these statistics were used to rank the significance of enrichments. Each panel displays the trade-off between false and true enrichment discoveries for all methods in 200 baseline and 200 enrichment datasets of a given simulation scenario, and also reports the corresponding areas under the curve (AUCs), where a higher value indicates better performance. Simulation details and additional results are provided in Supplementary Figures 1–4
Fig. 3
Fig. 3
Comparison of RSS-E to other methods for identifying gene-level associations from GWAS summary statistics. We used real genotypes to simulate individual-level data with and without enrichment in the target gene set (a “baseline”; b “enrichment”), each under two genetic architectures (“sparse” and “polygenic”), and then computed corresponding single-SNP summary statistics. On these summary data, we compared RSS-E with four other methods: SimpleM, VEGAS, GATES, and COMBAT. We applied VEGAS to the full set of SNPs (-sum), to a specified percentage of the most significant SNPs (−10% and −20%), and to the single most significant SNP (-max), within 100 kb of the transcribed region of each gene. All methods are available in the package COMBAT (Methods). For each simulated dataset, we defined a gene as “trait-associated” if at least one SNP within 100 kb of the transcribed region of this gene had nonzero effect. For each gene in each dataset, RSS-E produced the posterior probability that the gene was trait-associated. whereas the other methods produced association p values; these statistics were used to rank the significance of gene-level associations. Each panel displays the trade-off between false and true gene-level associations for all methods in 100 datasets of a given simulation scenario, and reports the corresponding AUCs. Simulation details and additional results are provided in Supplementary Figures 6, 7
Fig. 4
Fig. 4
Baseline and enrichment analyses of GWAS summary statistics for 31 complex traits. References of these data are provided in Supplementary Notes. a Summary of inferred effect size distributions of 31 traits. Results are from fitting the baseline model (M0) to GWAS summary statistics of 1.1 million common HapMap3 SNPs for each trait using variational inference (Methods). We summarize effect size distribution using two statistics: the estimated fraction of trait-associated SNPs (average posterior probability of a SNP being trait-associated; x-axis) and the standardized effect size of trait-associated SNPs (average posterior mean effect size of all SNPs, normalized by phenotypic standard deviation and fraction of trait-associated SNPs; y-axis). Each dot represents a trait, with horizontal and vertical point ranges indicating posterior mean and 95% credible interval. See Supplementary Notes for more details. Note that some intervals are too small to be visible due to log10 scales. See Supplementary Table 2 for numerical values of all intervals. b Pairwise sharing of 3913 pathway enrichments among 31 traits. For each pair of traits, we estimate the proportion of pathways that are enriched in both traits, among pathways enriched in at least one of the traits (Methods). Traits are clustered by hierarchical clustering as implemented in the package corrplot (Methods). Darker color and larger shape represent higher sharing. The sharing estimates are provided in Supplementary Table 3. ALS amyotrophic lateral sclerosis; DS depressive symptoms; LOAD late-onset Alzheimer’s disease; NEU neuroticism; SCZ schizophrenia; BMI body mass index; HEIGHT adult height; WHR waist-to-hip ratio; CD Crohn’s disease; IBD inflammatory bowel disease; RA rheumatoid arthritis; UC ulcerative colitis; ANM age at natural menopause; CAD coronary artery disease; FG fasting glucose; FI fasting insulin; GOUT gout; HDL high-density lipoprotein; HR heart rate; LDL low-density lipoprotein; MI myocardial infarction; T2D type 2 diabetes; TC total cholesterol; TG triglycerides; URATE serum urate; HB hemoglobin; MCH mean cell HB; MCHC MCH concentration; MCV mean cell volume; PCV packed cell volume; RBC red blood cell count
Fig. 5
Fig. 5
Enrichment of chylomicron-mediated lipid transport pathway informs a strong association between a member gene MTTP and levels of low-density lipoprotein (LDL) cholesterol. a Distribution of GWAS single-SNP z-scores from summary data published in 2010, stratified by gene set annotations. The solid green curve is estimated from z-scores of SNPs within 100 kb of the transcribed region of genes in the chylomicron-mediated lipid transport pathway (“inside”), and the dashed reddish purple curve is estimated from z-scores of remaining SNPs (“outside”). This panel serves as a visual sanity check to confirm the observed enrichment. b Estimated posterior probability (P1) that there is at least one associated SNP within 100 kb of the transcribed region of each pathway-member gene under the enrichment model (M1) versus estimated P1 under the baseline model (M0). These gene-level P1 estimates and corresponding SNP-level statistics are provided in Supplementary Table 4. Yellow asterisks denote genes that are less than 1 Mb away from a GWAS hit. Blue circles denote genes that are at least 1 Mb away from any GWAS hit. c Regional association plot for MTTP based on summary data published in 2010. d Regional association plot for MTTP based on summary data published in 2013
Fig. 6
Fig. 6
Enrichment analyses of genes related to liver, brain and adrenal gland for Alzheimer’s disease. Shown are the tissue-based gene sets with the strongest enrichment signals for Alzheimer’s disease. Each gene set was analyzed twice: the left panel corresponds to the analysis based on the original gene set; the right panel corresponds to the analysis where SNPs within 100 kb of the transcribed region of any gene in Apolipoproteins (APO) family (Methods) were excluded from the original gene set. Dashed reddish purple lines in both panel denote the same Bayes factor threshold (1000) used in the tissue-based analysis of all 31 traits (Table 3). HE highly expressed; SE selectively expressed; DE distinctively expressed

References

    1. Visscher PM, et al. 10 years of GWAS discovery: biology, function, and translation. Am. J. Hum. Genet. 2017;101:5–22. doi: 10.1016/j.ajhg.2017.06.005. - DOI - PMC - PubMed
    1. Price AL, Spencer CC, Donnelly P. Progress and promise in understanding the genetic basis of common diseases. Proc. R. Soc. B. 2015;282:20151684. doi: 10.1098/rspb.2015.1684. - DOI - PMC - PubMed
    1. Sham PC, Purcell SM. Statistical power and significance testing in large-scale genetic studies. Nat. Rev. Genet. 2014;15:335–346. doi: 10.1038/nrg3706. - DOI - PubMed
    1. Wang K, Li M, Hakonarson H. Analysing biological pathways in genome-wide association studies. Nat. Rev. Genet. 2010;11:843–854. doi: 10.1038/nrg2884. - DOI - PubMed
    1. de Leeuw CA, Neale BM, Heskes T, Posthuma D. The statistical properties of gene-set analysis. Nat. Rev. Genet. 2016;17:353–364. doi: 10.1038/nrg.2016.29. - DOI - PubMed

Publication types