. 2018 Oct 19;9(1):4350.
doi: 10.1038/s41467-018-06849-z.

Ventral pallidum encodes relative reward value earlier and more robustly than nucleus accumbens

Affiliations

Ventral pallidum encodes relative reward value earlier and more robustly than nucleus accumbens

David Ottenheimer et al. Nat Commun. .

Abstract

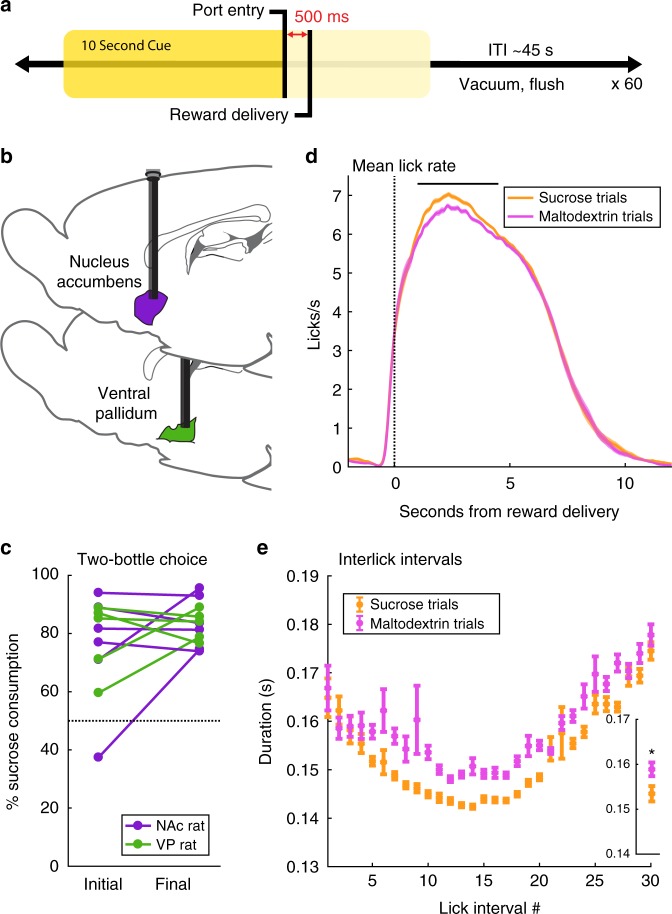
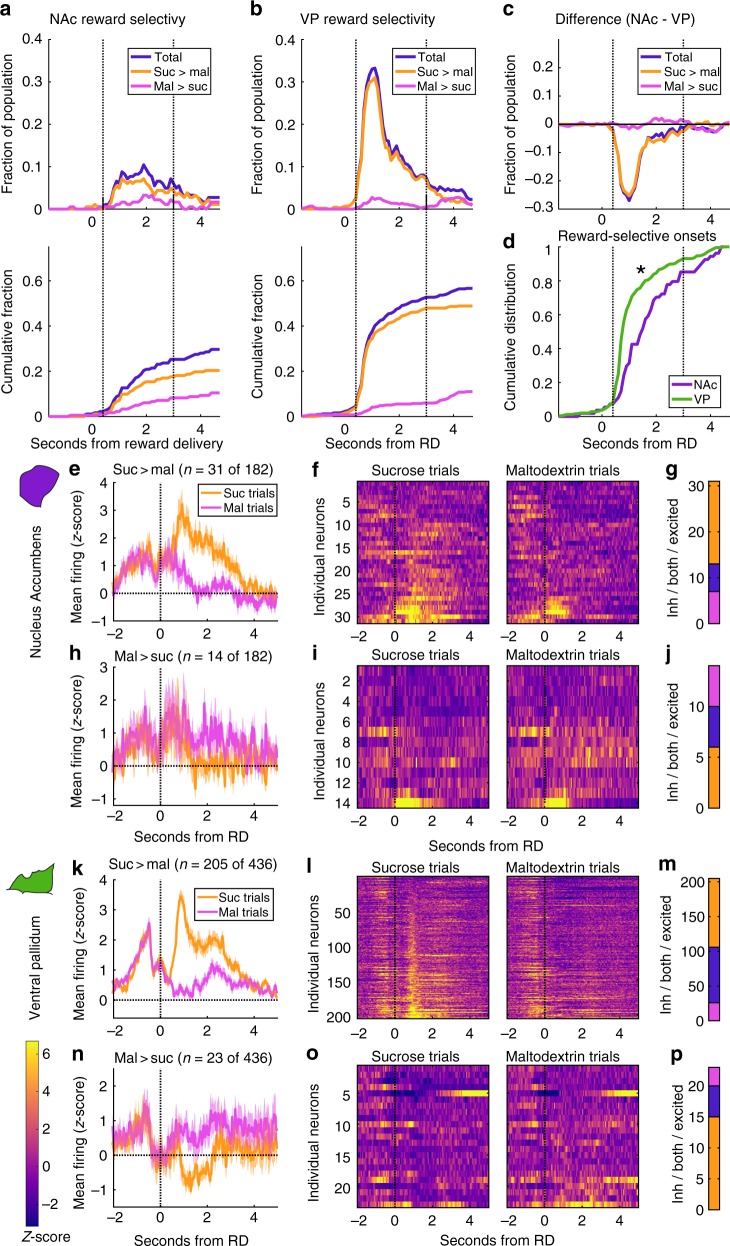
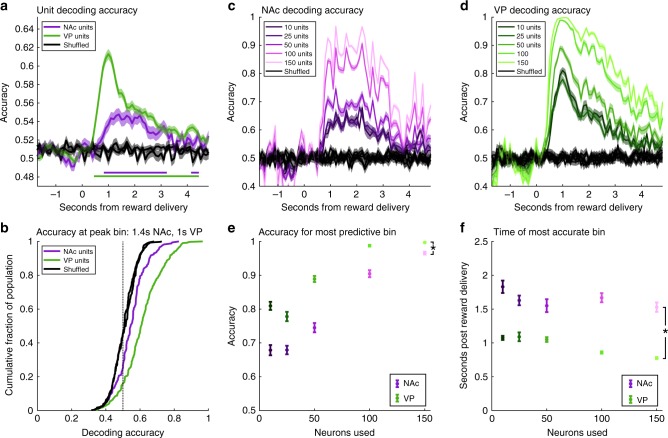
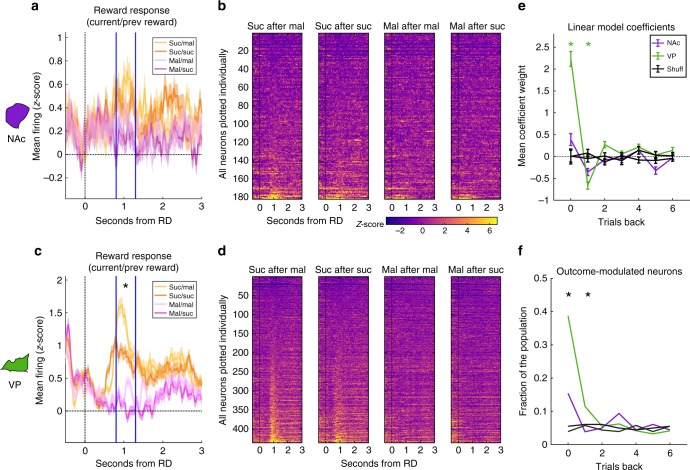
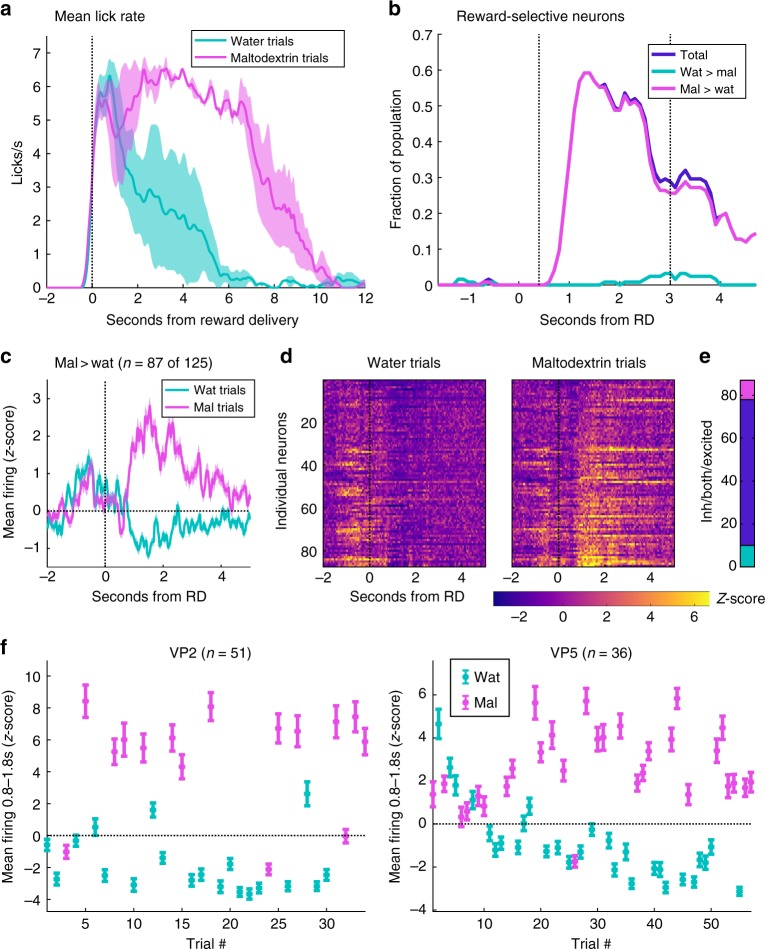
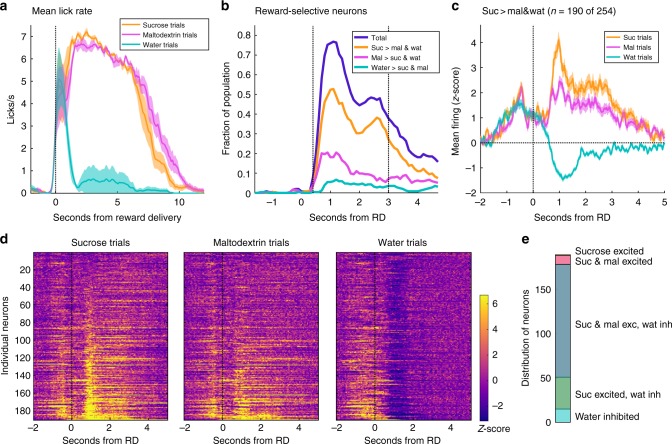
The ventral striatopallidal system, a basal ganglia network thought to convert limbic information into behavioral action, includes the nucleus accumbens (NAc) and the ventral pallidum (VP), typically described as a major output of NAc. Here, to investigate how reward-related information is transformed across this circuit, we measure the activity of neurons in NAc and VP when rats receive two highly palatable but differentially preferred rewards, allowing us to track the reward-specific information contained within the neural activity of each region. In VP, we find a prominent preference-related signal that flexibly reports the relative value of reward outcomes across multiple conditions. This reward-specific firing in VP is present in a greater proportion of the population and arises sooner following reward delivery than in NAc. Our findings establish VP as a preeminent value signaler and challenge the existing model of information flow in the ventral basal ganglia.


Conflict of interest statement

The authors declare no competing interests.

Figures

Fig. 1
Fig. 1
Preference for sucrose over maltodextrin in home cage drinking and following cued reward delivery. a Task design. Sucrose or maltodextrin solution was delivered 500 ms following rats’ entry into the reward port during a 10 s white noise cue. Trials of each reward were randomly interspersed throughout the session such that reward identity was unpredictable to the rat. b After training, drivable 16 electrode arrays were implanted in either nucleus accumbens (n = 6) or ventral pallidum (n = 5). See Supplementary Fig. 1 for placements. c Rats’ preference (percentage sucrose consumption of total consumption) during 1 h free access to 10% solutions of sucrose and maltodextrin. Tests were after surgical recovery (Initial) and after final session with sucrose and maltodextrin (Final). d Average lick rate on sucrose (orange) and maltodextrin (pink) trials during the task. Shading is SEM. Black bar indicates greater number of licks on sucrose trials 1–4.5 s post reward delivery (F(1,3142) = 66.0, p = 5.3E-6). See also Supplementary Fig. 2. e Interlick interval duration following the first 30 licks on sucrose (orange) and maltodextrin (pink) trials. Inset: mean interlick interval duration across all 30 intervals. Asterisk indicates significant main effect of reward on duration (F(1,3000) = 33.3, p = 0.000084)
Fig. 2
Fig. 2
More neurons in VP fire selectively for sucrose and maltodextrin than in NAc. a, b Top panel: fraction of NAc (a) and VP (b) neurons meeting criteria for reward selectivity as a function of time after reward delivery. Plotted are total fraction of reward-selective neurons (blue) and, of those, neurons with greater firing for sucrose (orange) and greater firing for maltodextrin (pink). Bottom panel: Cumulative distribution of reward selectivity over time after reward delivery. c Subtraction of VP reward selectivity from NAc in each bin. Negative values indicate more selectivity in VP. d Cumulative distribution of reward selectivity onsets as a fraction of total reward-selective neurons. Asterisk indicates significantly earlier onsets in VP (F(1,290) = 12.7, p = 0.00071). eg Neurons with greater firing for sucrose in any bin centered at 0.4–3 s. e Mean normalized firing rate for sucrose-selective neurons on sucrose (orange) and maltodextrin (pink) trials. Shading is SEM. f Heat maps of the normalized activity of individual sucrose-selective neurons on sucrose and maltodextrin trials. g Number of neurons with maltodextrin inhibitions (pink), sucrose excitations (orange), or both (blue). hj Neurons in NAc with greater firing rate for maltodextrin in any of the bins centered 0.4–3 s. h Mean normalized firing rate for maltodextrin-selective neurons on sucrose (orange) and maltodextrin (pink) trials. Shading is SEM. i Heat maps of the normalized activity of individual maltodextrin-selective neurons in NAc on sucrose and maltodextrin trials. j Number of neurons in NAc with maltodextrin inhibitions (pink), sucrose excitations (orange), or both (blue). kp Sucrose- (km) and maltodextrin- (np) selective neurons in VP, plotted as for NAc neurons in ej
Fig. 3
Fig. 3
VP activity decodes trial identity earlier and more accurately than NAc activity. a Average cross-validated decoding accuracy relative to reward delivery time, determined using linear discriminant analysis models trained on spiking data of individual neurons across 600 ms overlapping bins. Decoding accuracy for NAc (purple), VP (green), and data with shuffled trial identity from each region (black). Shading is SEM. Purple (NAc) and green (VP) lines indicate consecutive bins where accuracy exceeds 99% confidence interval of corresponding shuffled data. b Cumulative distribution of accuracies in the bin with the greatest average accuracy in each region (centered at 1.4 s in NAc and 1 s in VP) and the corresponding shuffled data from that bin in each region. c Average cross-validated decoding accuracy of linear discriminant analysis models trained on spiking data of 20 randomly selected groups of 10, 25, 50, 100, or 150 neurons in NAc across 600 ms overlapping bins relative to reward delivery time and corresponding models trained on data with trial identity shuffled. Shading is SEM. d Same as (c) for VP pseudoensemble models. e Average accuracy of each replicate for the bin with peak accuracy for each pseudoensemble size in each region. Asterisk indicates significant main effect of region on accuracy (F(1,490) = 212, p = 3.3E-40). f Average peak accuracy time post-reward for each replicate of each pseudoensemble size in each region. Asterisk indicates significant main effect of region on peak accuracy time (F(1,490) = 289, p = 2.5E-51)
Fig. 4
Fig. 4
Previous reward outcome impacts current reward firing. a, c Normalized activity of all neurons in NAc (a) and VP (c) on sucrose (orange) and maltodextrin (pink) trials of each reward, separated by reward outcome on preceding trial; darker lines indicate that sucrose was the prior trial’s reward. Asterisk indicates a significant main effect of previous reward on normalized firing rate in VP (F(1,1724) = 10.1, p = 0.022) for the epoch bounded by the vertical blue lines. b, d Normalized reward-related activity of every individual neuron in NAc (b) and VP (d) on trials with each combination of previous and current reward. e Mean coefficient weights for the impact of the current and previous 6 trials on normalized firing rate in the same epoch as (a, c) for each neuron in NAc (purple), VP (green), and corresponding data for each neuron with the outcomes shuffled (black) for each region. Error bars are SEM. Asterisks are p < 0.05 for Tukey tests comparing VP coefficients to shuffled data, corrected for multiple comparisons. f Proportion of the neural populations in VP (green), NAc (purple), and corresponding shuffled neurons (black) with significant coefficients for each of the relative trials. Asterisks represent p < 0.05 for chi-square tests on both the distribution of neurons across all four conditions (true and shuffled data from each region) and across the true data from each region
Fig. 5
Fig. 5
VP reward-selective activity adjusts to reflect relative value of new outcomes. a Lick rate on water (blue) and maltodextrin (pink) trials. Shading is SEM. b Fraction of VP neurons that meet criteria for reward selectivity relative to reward delivery time (as in Fig. 2). Plotted are the total fraction of reward-selective neurons (dark blue) and, of those, neurons with greater firing for maltodextrin (pink) and greater firing for water (light blue). Dashed lines indicate the window (0.4–3 s) for which reward-selective neurons were selected for (c) and (d). ce Neurons with greater firing for maltodextrin in any of the bins centered 0.4–3 s. c Average normalized firing rate for these neurons on water (blue) and maltodextrin (pink) trials. Shading is SEM. d Heat maps of the normalized activity of individual neurons on water and maltodextrin trials. e Number of neurons with maltodextrin excitations (pink), water inhibitions (light blue), or both (dark blue). f Emergence of maltodextrin (pink) excitations and water (blue) inhibitions among reward-selective neurons across each completed trial of the session. Plotted as mean normalized activity 0.8–1.8 s post reward delivery; error bars are SEM
Fig. 6
Fig. 6
VP neurons report the relative value of three reward outcomes. a Lick rate on sucrose (orange), maltodextrin (pink), and water (blue) trials. Shading is SEM. b Histogram of the fraction of neurons in VP that meet criteria for reward selectivity relative to reward delivery time. Plotted are the total fraction of reward-selective neurons (dark blue) and, of those, neurons with greatest firing for sucrose (orange), maltodextrin (pink), or water (light blue). Dashed lines indicate the window (0.4–3 s) for which reward-selective neurons were selected for (ce). c Mean normalized firing rate of neurons that are reward-selective for any bin 0.4–3 s post reward delivery and have greatest firing rate for sucrose. Shading is SEM. d Normalized firing rate of individual neurons included in c. Neurons in all three plots are sorted by amount of firing on sucrose trials in the bin with the most number of neurons with greatest firing for sucrose. e Distribution of neurons in (c) and (d) according to sucrose excitation, maltodextrin excitation, and water inhibition

Similar articles

Cited by

References

    1. Alexander G, DeLong M, Strick P. Parallel organization of functionally segregated circuits linking basal ganglia and cortex. Annu. Rev. Neurosci. 1986;9:357–381. doi: 10.1146/annurev.ne.09.030186.002041. - DOI - PubMed
    1. Groenewegen H, Wright C, Beijer A, Voorn P. Convergence and segregation of ventral striatal inputs and outputs. Ann. N. Y. Acad. Sci. 1999;877:49–63. doi: 10.1111/j.1749-6632.1999.tb09260.x. - DOI - PubMed
    1. de Olmos J, Heimer L. The concepts of the ventral striatopallidal system and extended amygdala. Ann. N. Y. Acad. Sci. 1999;877:1–32. doi: 10.1111/j.1749-6632.1999.tb09258.x. - DOI - PubMed
    1. Goto Y, Grace AA. Limbic and cortical information processing in the nucleus accumbens. Trends Neurosci. 2008;31:552–558. doi: 10.1016/j.tins.2008.08.002. - DOI - PMC - PubMed
    1. Groenewegen H, Wright C, Beijer A. The nucleus accumbens: gateway for limbic structures to reach the motor system? Prog. Brain. Res. 1996;107:485–511. doi: 10.1016/S0079-6123(08)61883-X. - DOI - PubMed

Publication types