

Nonstationary Temperature-Duration-Frequency curves
- PMID: 30341366
- PMCID: PMC6195567
- DOI: 10.1038/s41598-018-33974-y
Nonstationary Temperature-Duration-Frequency curves
Abstract
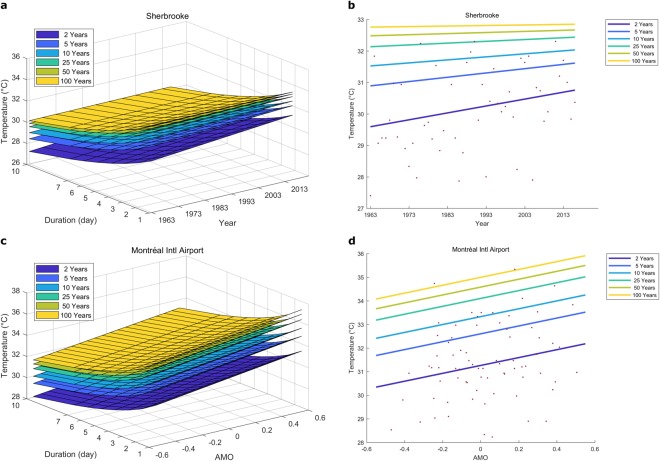
Persistent extreme heat events are of growing concern in a climate change context. An increase in the intensity, frequency and duration of heat waves is observed in several regions. Temperature extremes are also influenced by global-scale modes of climate variability. Temperature-Duration-Frequency (TDF) curves, which relate the intensity of heat events of different durations to their frequencies, can be useful tools for the analysis of heat extremes. To account for climate external forcings, we develop a nonstationary approach to the TDF curves by introducing indices that account for the temporal trend and teleconnections. Nonstationary TDF modeling can find applications in adaptive management in the fields of health care, public safety and energy production. We present a one-step method, based on the maximization of the composite likelihood of observed heat extremes, to build the nonstationary TDF curves. We show the importance of integrating the information concerning climate change and climate oscillations. In an application to the province of Quebec, Canada, the influence of Atlantic Multidecadal Oscillations (AMO) on heat events is shown to be more important than the temporal trend.
Conflict of interest statement
The authors declare no competing interests.
Figures

Similar articles
-
Prediction of heatwave related mortality magnitude, duration and frequency with climate variability and climate change information.Stoch Environ Res Risk Assess. 2024;38(11):4471-4483. doi: 10.1007/s00477-024-02813-0. Epub 2024 Oct 1. Stoch Environ Res Risk Assess. 2024. PMID: 39492842 Free PMC article.
-
Trends in the consecutive days of temperature and precipitation extremes in China during 1961-2015.Environ Res. 2018 Feb;161:381-391. doi: 10.1016/j.envres.2017.11.037. Epub 2017 Nov 29. Environ Res. 2018. PMID: 29197279
-
Heat-related mortality prediction using low-frequency climate oscillation indices: Case studies of the cities of Montréal and Québec, Canada.Environ Epidemiol. 2022 Mar 31;6(2):e206. doi: 10.1097/EE9.0000000000000206. eCollection 2022 Apr. Environ Epidemiol. 2022. PMID: 35434457 Free PMC article.
-
Temperature extremes and health: impacts of climate variability and change in the United States.J Occup Environ Med. 2009 Jan;51(1):13-25. doi: 10.1097/JOM.0b013e318173e122. J Occup Environ Med. 2009. PMID: 19136869 Review.
-
Temperature extremes: geographic patterns, recent changes, and implications for organismal vulnerabilities.Glob Chang Biol. 2016 Dec;22(12):3829-3842. doi: 10.1111/gcb.13313. Epub 2016 May 12. Glob Chang Biol. 2016. PMID: 27062158 Review.
Cited by
-
Prediction of heatwave related mortality magnitude, duration and frequency with climate variability and climate change information.Stoch Environ Res Risk Assess. 2024;38(11):4471-4483. doi: 10.1007/s00477-024-02813-0. Epub 2024 Oct 1. Stoch Environ Res Risk Assess. 2024. PMID: 39492842 Free PMC article.
-
Changes in the distribution of hydro-climatic extremes in a non-stationary framework.Sci Rep. 2019 May 30;9(1):8104. doi: 10.1038/s41598-019-44603-7. Sci Rep. 2019. PMID: 31147622 Free PMC article.
-
Utilizing non-stationary extreme value model to quantify extreme rainfall in two major cities in Bangladesh.Stoch Environ Res Risk Assess. 2025;39(6):2281-2296. doi: 10.1007/s00477-025-02969-3. Epub 2025 Apr 7. Stoch Environ Res Risk Assess. 2025. PMID: 40575036 Free PMC article.
-
Amplified risk of compound heat stress-dry spells in Urban India.Clim Dyn. 2023;60(3-4):1061-1078. doi: 10.1007/s00382-022-06324-y. Epub 2022 Jun 20. Clim Dyn. 2023. PMID: 35754938 Free PMC article.
-
Compounded wind gusts and maximum temperature via semiparametric copula in the risk assessments of power blackouts and air conditioning demands for major cities in Canada.Sci Rep. 2024 Jul 1;14(1):15031. doi: 10.1038/s41598-024-65413-6. Sci Rep. 2024. PMID: 38951564 Free PMC article.
References
-
- Coumou D, Robinson A. Historic and future increase in the global land area affected by monthly heat extremes. Environ. Res. Lett. 2013;8:034018. doi: 10.1088/1748-9326/8/3/034018. - DOI
-
- Katz RW, Brown BG. Extreme events in a changing climate: Variability is more important than averages. Clim. Change. 1992;21:289–302. doi: 10.1007/BF00139728. - DOI
-
- Perkins SE, Alexander LV, Nairn JR. Increasing frequency, intensity and duration of observed global heatwaves and warm spells. Geophys. Res. Lett. 2012;39:L20714. doi: 10.1029/2012GL053361. - DOI
Publication types
LinkOut - more resources
Full Text Sources
