. 2018 Oct 19;8(1):15494.
doi: 10.1038/s41598-018-33492-x.

Relative positioning of Kv11.1 (hERG) K+ channel cytoplasmic domain-located fluorescent tags toward the plasma membrane

Affiliations

Relative positioning of Kv11.1 (hERG) K+ channel cytoplasmic domain-located fluorescent tags toward the plasma membrane

Francisco Barros et al. Sci Rep. .

Abstract

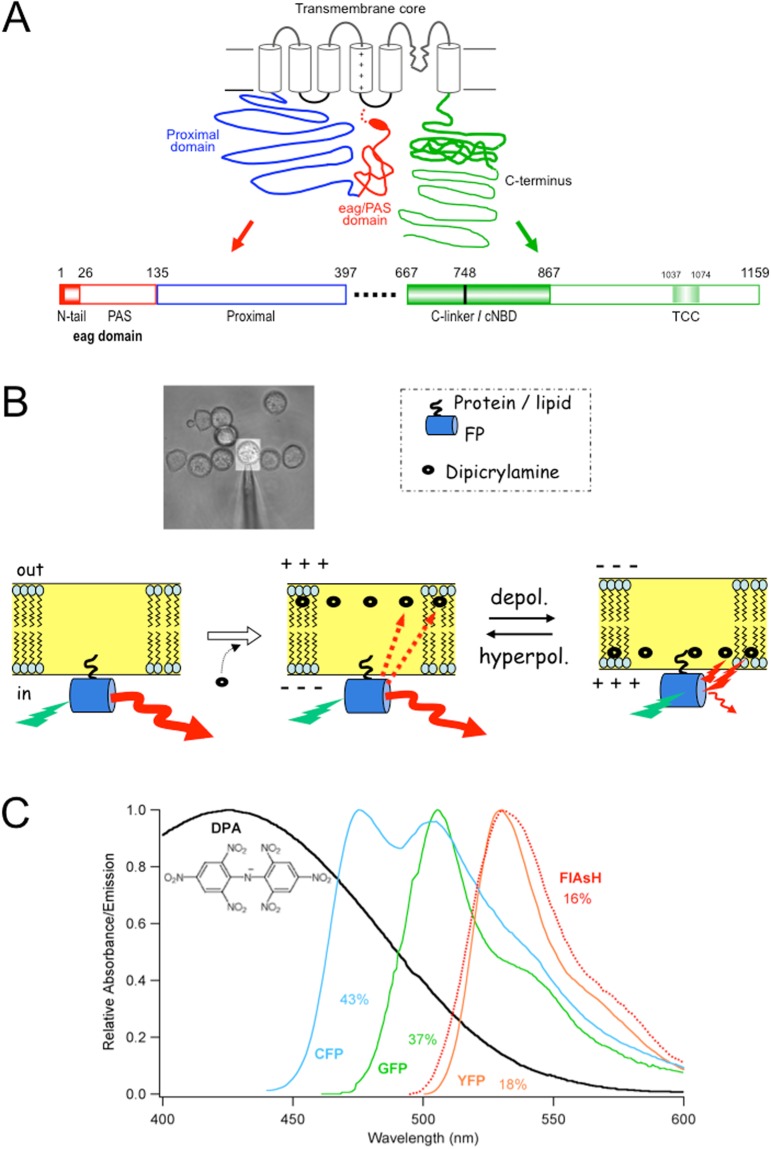
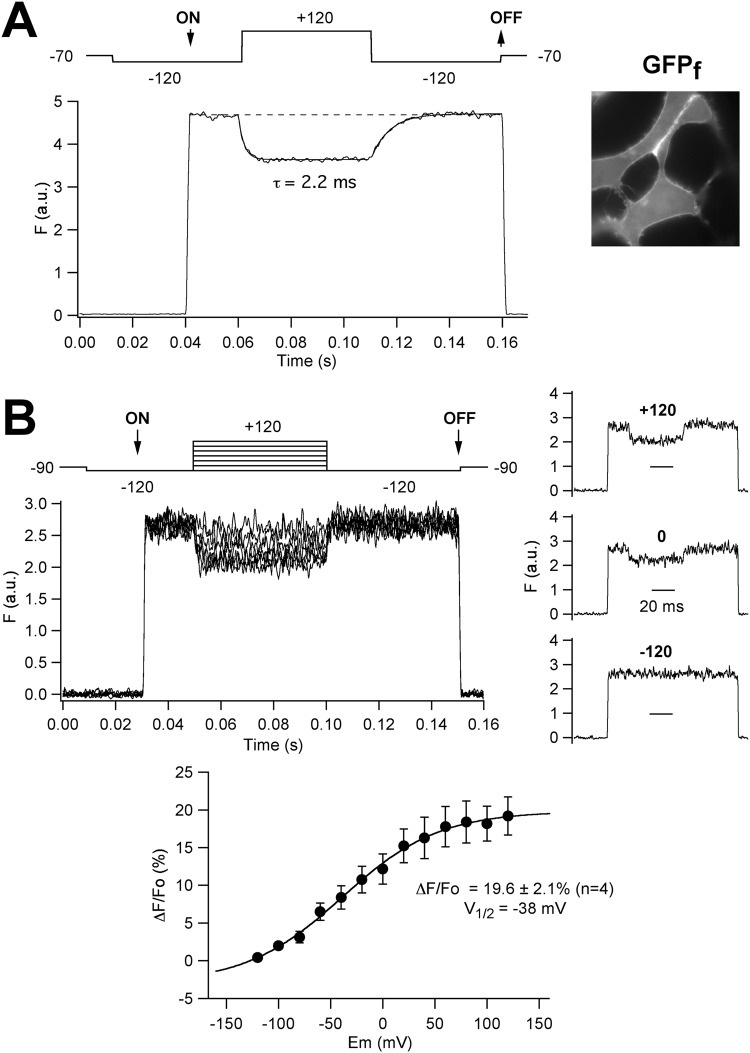
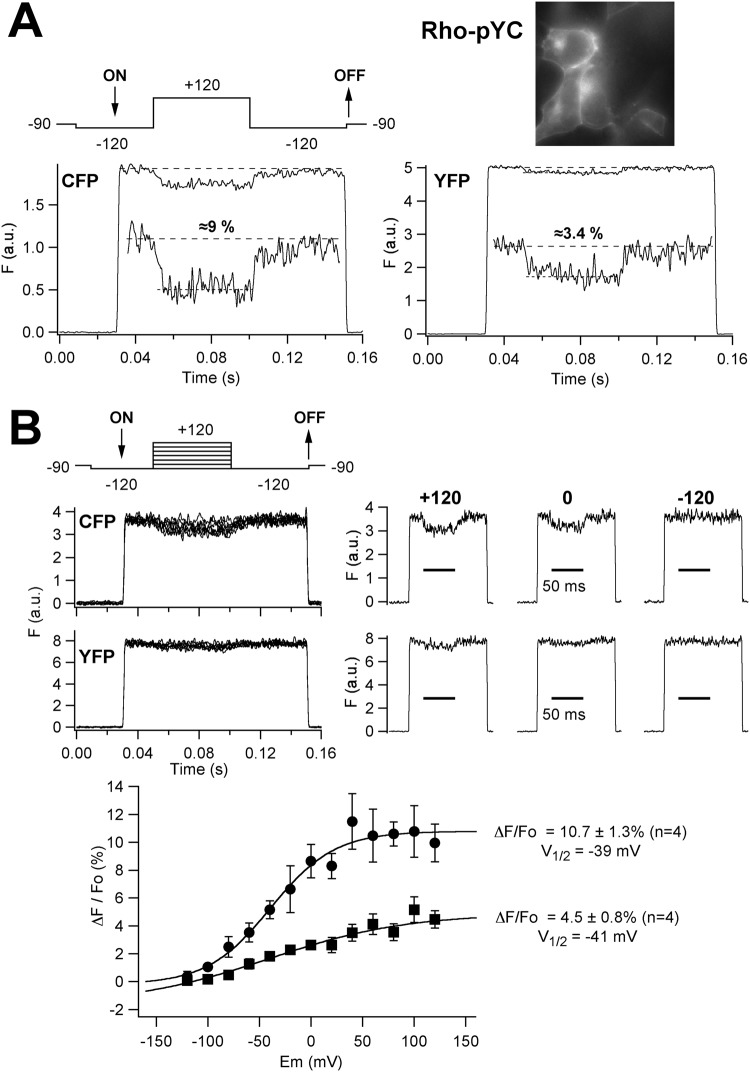
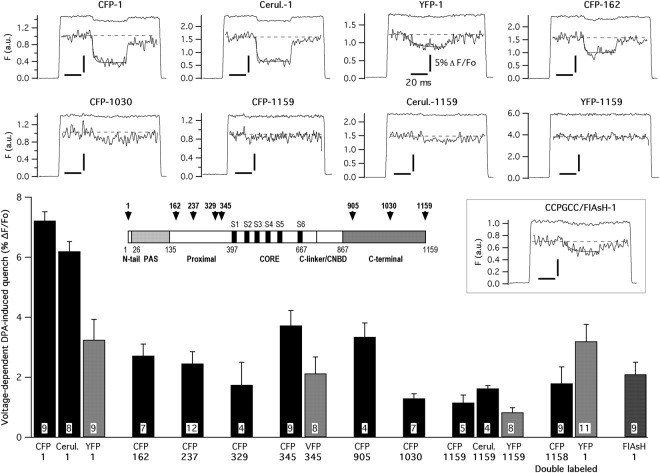
Recent cryo-EM data have provided a view of the KCNH potassium channels molecular structures. However, some details about the cytoplasmic domains organization and specially their rearrangements associated to channel functionality are still lacking. Here we used the voltage-dependent dipicrylamine (DPA)-induced quench of fluorescent proteins (FPS) linked to different positions at the cytoplasmic domains of KCNH2 (hERG) to gain some insights about the coarse structure of these channel parts. Fast voltage-clamp fluorometry with HEK293 cells expressing membrane-anchored FPs under conditions in which only the plasma membrane potential is modified, demonstrated DPA voltage-dependent translocation and subsequent FRET-triggered FP quenching. Our data demonstrate for the first time that the distance between an amino-terminal FP tag and the intracellular plasma membrane surface is shorter than that between the membrane and a C-terminally-located tag. The distances varied when the FPs were attached to other positions along the channel cytoplasmic domains. In some cases, we also detected slower fluorometric responses following the fast voltage-dependent dye translocation, indicating subsequent label movements orthogonal to the plasma membrane. This finding suggests the existence of additional conformational rearrangements in the hERG cytoplasmic domains, although their association with specific aspects of channel operation remains to be established.


Conflict of interest statement

The authors declare no competing interests.

Figures

Figure 1
Figure 1
General topology of a hERG channel α-subunit and schematics of the DPA-based voltage-dependent FRET measurements. (A) Schematic representation of a hERG channel α-subunit indicating the relative positioning of the amino terminal eag/PAS and proximal domains up to the first transmembrane helix, and the C-terminus regions following the sixth transmembrane helix. The N-tail region including an initial flexible segment (dotted line) and the amphipatic α-helix (oval) connecting it to the Per-Arnt-sim (PAS) sub-domain (continuous line) of the eag domain, are depicted in red. The C-terminus is colored green. Linear diagrams of the amino and carboxy termini are shown at the bottom. The size of every segment is represented on a horizontal scale proportional to the total length of the fragments. The numbers correspond to the residues of the hERG sequence marking the boundaries of the different regions. The position of the C-linker/cNBD domains directly linked to the bottom of helix S6 and the location of a proposed tetramerization coiled-coil (TCC) are also shown at the C-terminus. The transmembrane core region containing the six transmembrane helices depicted as cylinders and the corresponding linkers are represented in black. The approximate points of FP insertion used are signaled by asterisks in the upper scheme and placed in their respective position in the lower linear diagrams. (B) Schematic representation of voltage-dependent DPA movements and FRET interactions with membrane-anchored FP fluorophores. An illustration of reversible DPA (black ovals) translocation in response to membrane voltage variations and the corresponding modifications in the fluorescence of an FP (yellow barrel) tag anchored to the internal membrane surface are shown. Different arrow length and thickness are used to highlight the change in fluorescence due to DPA approaching the donor upon depolarization and subsequent decrease of FP fluorescence as a result of increased FRET. A transmission image (40x objective) of the microscope field with the HEK293 cells and recording pipette attached to the selected cell limited by the ViewFinder selection mask (see Methods) is shown in the upper inset. (C) Spectral overlap (%) of CFP, GFP, YFP and FlAsH emission and DPA absorption. The structure of the negatively charged amphiphatic DPA molecule is shown in the inset.
Figure 2
Figure 2
Voltage-dependent DPA-induced effects on patch-clamped HEK293 cells expressing plasma membrane-targeted green fluorescent protein (GFPf) carrying a farnesylation tag. (A) Time course of the fluorescent response on voltage pulses (shown on top of the traces) from −120 to +120 mV in the presence of 10 μM DPA. The time at which the monochromator wavelength was changed from 470 nm (corresponding to a zero volt input) to 498 nm and vice versa, is marked as ON and OFF, respectively. Note that no fluorescence is detected at 470 nm due to the cutoff properties of the filter set employed. For details, see Methods. Averaged responses (in arbitrary units) from 30 trials delivered at 1 s intervals are shown. The superimposed line corresponds to a mono-exponential fit to the data. A fluorescence image of the cells (100x oil-immersion objective) demonstrating the prominent plasma membrane distribution of the GFPf signal is shown on the right. (B) Voltage dependence of the DPA-induced effects. A family of superimposed fluorescence traces in response to voltage steps as illustrated at the top including a central pulse from −120 to +120 mV at 10 mV intervals is shown on the upper left panel. Only results from pulses every 20 mV are shown on the graph for simplicity. For every voltage, traces correspond to averaged responses from 10 repetitive trials delivered at 1 s intervals. Separate traces obtained at +120, 0 and −120 mV are shown on the right. A plot of ΔF/Fo versus voltage, obtained from pulse responses such as those at the top, is shown at the bottom. Averaged responses from four individual cells are illustrated in the graph. A Boltzmann curve fitted to the data with V1/2 = −38 mV is also shown.
Figure 3
Figure 3
Voltage-dependent DPA-induced effects on patch-clamped HEK293 cells expressing the plasma membrane-targeted CFP-YFP Rho-pYC tandem. (A) Time course of the fluorescent response on voltage pulses from −120 to +120 mV (upper left panel) in the presence of 10 μM DPA. A fluorescence image of the cells (100x oil-immersion objective) demonstrating the marked plasma membrane distribution of the Rho-pYC signal is shown on the right. Representative fluorescence traces at excitation wavelengths of 440 (CFP) and 510 nm (YFP) are shown. Averaged responses from 50 trials delivered at 1 s intervals are illustrated on the graphs. Expanded sections of the fluorescence traces are shown in the insets. The estimated ΔF/Fo values expressed as % are also indicated. (B) Voltage dependence of the DPA-induced effects. Families of superimposed fluorescence traces in response to voltage steps as illustrated at the top are shown on the upper left panel. Separate traces obtained at +120, 0 and −120 mV are shown on the right. Plots of ΔF/Fo versus voltage with a Boltzmann curve fitted to the data, corresponding to the CFP (circles) and YFP (squares) signals, are shown at the bottom. V1/2 and maximal ΔF/Fo values obtained from the curves are indicated.
Figure 4
Figure 4
DPA voltage-dependent fluorescence quenching of hERG channels tagged with FPs at different positions. Representative fluorescence traces obtained in response to voltage step sequences such as those illustrated in Figs 1A and 2A, including a central pulse from −120 to +120 mV, are shown at the top. Data from patch-clamped HEK293 cells expressing hERG channels tagged with CFP, cerulean and YFP at the amino and carboxy ends, and with CFP at positions 162 and 1030 of the channel sequence are shown. Excitation wavelengths of 440 (CFP and cerulean) and 510 nm (YFP) were used. Averaged responses from 50 trials delivered at 1 s intervals are illustrated on the graphs. Expanded sections of the fluorescence traces are shown in the insets. In all cases, vertical and horizontal calibration bars correspond to 5% ΔF/Fo and 20 ms, respectively. Superimposed lines corresponding to mono-exponential fits to the data are shown on the upper file. Results from an analogous experiment using cells expressing a channel construct carrying an amino terminal CCPGCC sequence that was subsequently labeled with a FlAsH fluorophore (see text for details), are also shown. A summary of the DPA-dependent effects obtained with all the tested channel constructs is depicted at the bottom, indicating the number of tested cells and with the fluorophore and the point of insertion indicated below the bars of the histogram. A schematic linear diagram of the hERG channel in which the size of each domain is represented proportional to the total length of the protein is shown in the inset. The position of the boundaries between the different channel domains is marked with numbers. The places at which the fluorescent tags tested here were introduced are also indicated (arrows).
Figure 5
Figure 5
Cellular localization of hERG fluorescent fusion proteins carrying amino and carboxy terminal attached FPs. Representative cells expressing hERG-labeled channels with YFP at position 1 or 1159 or double-labeled 1YFP/1158CFP as indicated, and imaged by epifluorescence microscopy as described in Methods, are shown on the left. The top row corresponds to cells expressing the CFP-YFP Rho-pYC tandem. Fluorescence intensity profiles along the depicted white line are shown on the right. Arrows indicate the position of the fluorescence signal corresponding to the plasma membrane contour. Numbers in the profile panels indicate the values of the fluorescence intensity ratios obtained dividing the averaged fluorescence of the image pixels corresponding to a line traced on top of the cell edge (see Suppl. Fig. 2 for details) by the averaged fluorescence in the internal cell area.
Figure 6
Figure 6
Detection of slowly developing DPA-induced quenching in response to longer depolarizing steps. (A) Schematic representation of possible secondary tag movements and hypothetical time course of fluorescence signals (F, red lines) in response to more prolonged depolarizing pulses (V, black lines), following the initial fast translocation of DPA. (B) Typical voltage-dependent DPA-induced response from cells expressing GFPf in response to 500 ms depolarization steps as shown on top of the trace. Averaged responses from 50 trials delivered at 2 s intervals are shown. An expanded section of the fluorescence trace is shown in the inset. (C) Representative fluorometric trace from cells expressing hERG channels tagged with CFP at the amino end submitted to voltage-clamp steps as in panel A. A bi-exponential fit is shown superimposed to the data from which time constants of 8 and 275 ms were obtained as indicated. (D) Representative response from cells expressing hERG channels tagged with CFP at position 162. A bi-exponential fit with time constants of 5 and 305 ms is shown superimposed to the data.

Similar articles

Cited by

References

    1. Barros F, Domínguez P, de la Peña P. Cytoplasmic domains and voltage-dependent potassium channel gating. Front. Pharmacol. 2012;3:49. doi: 10.3389/fphar.2012.00049. - DOI - PMC - PubMed
    1. Vandenberg JI, et al. hERG K+ channels: Structure, function, and clinical significance. Physiol. Rev. 2012;92:1393–1478. doi: 10.1152/physrev.00036.2011. - DOI - PubMed
    1. Babcock JJ, Li M. hERG channel function: beyond long QT. Acta Pharmacol. Sin. 2013;34:329–335. doi: 10.1038/aps.2013.6. - DOI - PMC - PubMed
    1. Pardo LA, Stühmer W. The roles of K+ channels in cancer. Nat. Rev. Cancer. 2014;14:39–48. doi: 10.1038/nrc3635. - DOI - PubMed
    1. Matsuura H, Ehara T, Ding W-G, Omatsu-Kanbe M, Isono T. Rapidly and slowly activating components of delayed rectifier K+ current in guinea-pig sino-atrial node pacemaker cells. J. Physiol. 2002;540:815–830. doi: 10.1113/jphysiol.2001.016741. - DOI - PMC - PubMed

Publication types