

A comparison of different methods to handle missing data in the context of propensity score analysis
- PMID: 30341708
- PMCID: PMC6325992
- DOI: 10.1007/s10654-018-0447-z
A comparison of different methods to handle missing data in the context of propensity score analysis
Abstract
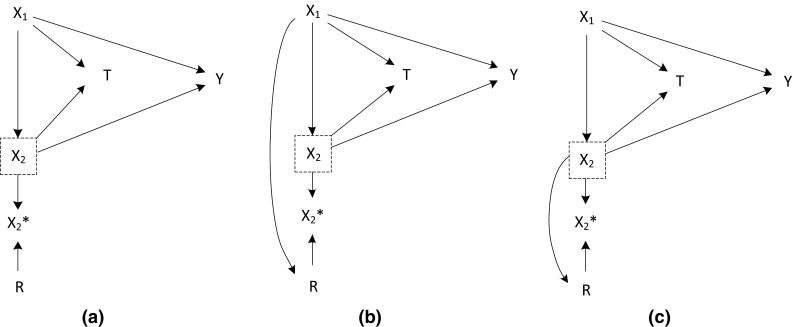
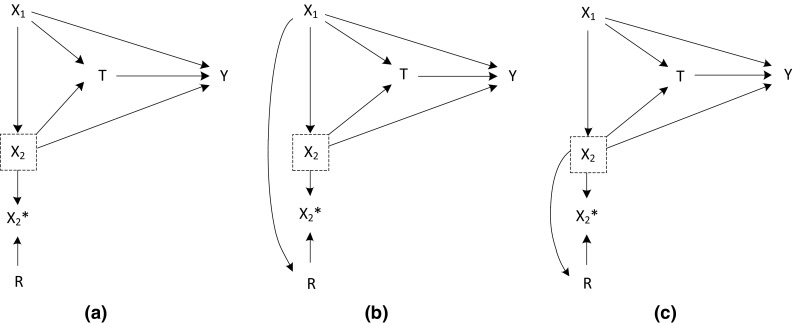
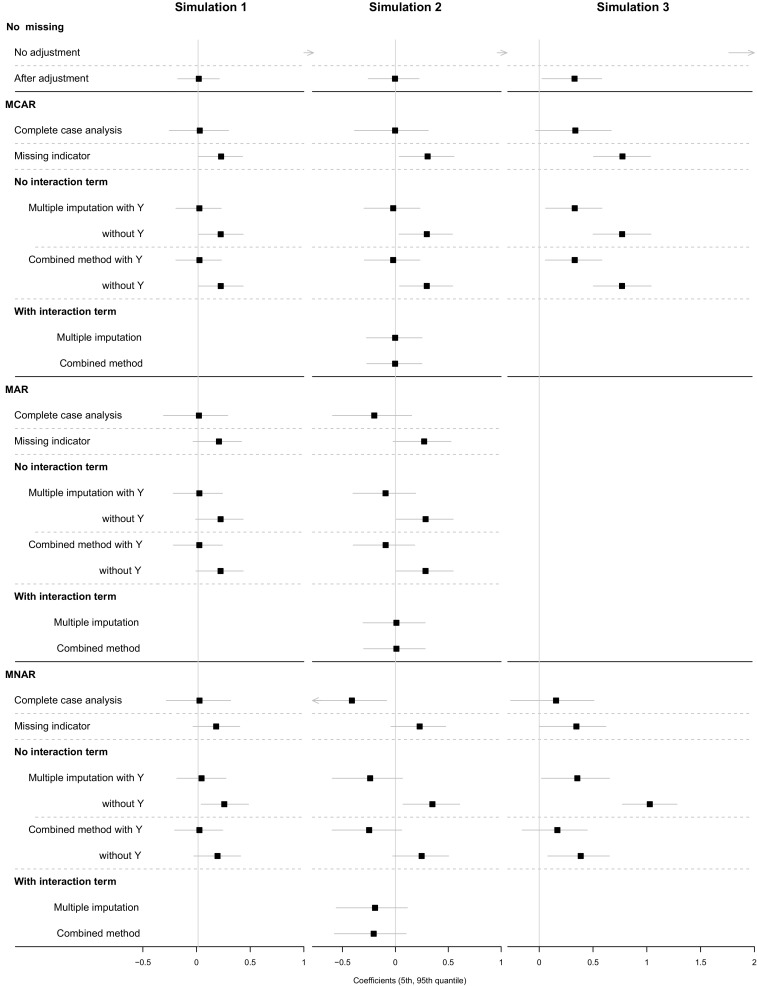
Propensity score analysis is a popular method to control for confounding in observational studies. A challenge in propensity methods is missing values in confounders. Several strategies for handling missing values exist, but guidance in choosing the best method is needed. In this simulation study, we compared four strategies of handling missing covariate values in propensity matching and propensity weighting. These methods include: complete case analysis, missing indicator method, multiple imputation and combining multiple imputation and missing indicator method. Concurrently, we aimed to provide guidance in choosing the optimal strategy. Simulated scenarios varied regarding missing mechanism, presence of effect modification or unmeasured confounding. Additionally, we demonstrated how missingness graphs help clarifying the missing structure. When no effect modification existed, complete case analysis yielded valid causal treatment effects even when data were missing not at random. In some situations, complete case analysis was also able to partially correct for unmeasured confounding. Multiple imputation worked well if the data were missing (completely) at random, and if the imputation model was correctly specified. In the presence of effect modification, more complex imputation models than default options of commonly used statistical software were required. Multiple imputation may fail when data are missing not at random. Here, combining multiple imputation and the missing indicator method reduced the bias as the missing indicator variable can be a proxy for unobserved confounding. The optimal way to handle missing values in covariates of propensity score models depends on the missing data structure and the presence of effect modification. When effect modification is present, default settings of imputation methods may yield biased results even if data are missing at random.
Keywords: Effect modification; Missing data; Missing indicator; Missingness graph; Multiple imputation; Propensity score analysis.
Conflict of interest statement
The authors declare that they have no conflict of interest.
Figures

Similar articles
-
Propensity score analysis with partially observed covariates: How should multiple imputation be used?Stat Methods Med Res. 2019 Jan;28(1):3-19. doi: 10.1177/0962280217713032. Epub 2017 Jun 2. Stat Methods Med Res. 2019. PMID: 28573919 Free PMC article.
-
Multiple imputation with missing indicators as proxies for unmeasured variables: simulation study.BMC Med Res Methodol. 2020 Jul 8;20(1):185. doi: 10.1186/s12874-020-01068-x. BMC Med Res Methodol. 2020. PMID: 32640992 Free PMC article.
-
Propensity score matching after multiple imputation when a confounder has missing data.Stat Med. 2023 Mar 30;42(7):1082-1095. doi: 10.1002/sim.9658. Epub 2023 Jan 25. Stat Med. 2023. PMID: 36695043 Free PMC article.
-
Review: a gentle introduction to imputation of missing values.J Clin Epidemiol. 2006 Oct;59(10):1087-91. doi: 10.1016/j.jclinepi.2006.01.014. Epub 2006 Jul 11. J Clin Epidemiol. 2006. PMID: 16980149 Review.
-
Common Methods for Handling Missing Data in Marginal Structural Models: What Works and Why.Am J Epidemiol. 2021 Apr 6;190(4):663-672. doi: 10.1093/aje/kwaa225. Am J Epidemiol. 2021. PMID: 33057574 Free PMC article. Review.
Cited by
-
Contribution of socio-demographic and clinical characteristics to predict initial referrals to psychosocial interventions in patients with serious mental illness.Epidemiol Psychiatr Sci. 2024 Jan 29;33:e2. doi: 10.1017/S2045796024000015. Epidemiol Psychiatr Sci. 2024. PMID: 38282331 Free PMC article.
-
Effectiveness of Angiotensin II for Catecholamine Refractory Septic or Distributive Shock on Mortality: A Propensity Score Weighted Analysis of Real-World Experience in the Medical ICU.Crit Care Explor. 2022 Jan 18;4(1):e0623. doi: 10.1097/CCE.0000000000000623. eCollection 2022 Jan. Crit Care Explor. 2022. PMID: 35072084 Free PMC article.
-
Anatomic distribution of lower extremity deep venous thrombosis is associated with an increased risk of pulmonary embolism: A 10-year retrospective analysis.Front Cardiovasc Med. 2023 Mar 22;10:1154875. doi: 10.3389/fcvm.2023.1154875. eCollection 2023. Front Cardiovasc Med. 2023. PMID: 37034353 Free PMC article.
-
Robust estimation of dementia prevalence from two-phase surveys with non-responders via propensity score stratification.BMC Med Res Methodol. 2023 May 27;23(1):130. doi: 10.1186/s12874-023-01954-0. BMC Med Res Methodol. 2023. PMID: 37237383 Free PMC article.
-
Target Trial Emulation and Bias Through Missing Eligibility Data: An Application to a Study of Palivizumab for the Prevention of Hospitalization Due to Infant Respiratory Illness.Am J Epidemiol. 2023 Apr 6;192(4):600-611. doi: 10.1093/aje/kwac202. Am J Epidemiol. 2023. PMID: 36509514 Free PMC article. Clinical Trial.
References
-
- Rosenbaum PR, Rubin DB. The central role of the propensity score in observational studies for causal effects. Biometrika. 1983;70(1):41–55. doi: 10.1093/biomet/70.1.41. - DOI
Publication types
MeSH terms
LinkOut - more resources
Full Text Sources
Medical
